- Dynatrace Community
- Learn
- Troubleshooting
- Unable to see Jboss connection pool in the Dynatrace Host view
- Subscribe to RSS Feed
- Mark as New
- Mark as Read
- Printer Friendly Page
- Mark as New
- Subscribe to RSS Feed
- Permalink
on 21 Jul 2023 12:13 PM
Self Service Summary
You have enabled Dynatarce OneAgent extensions for JBOSS to provide insight into connection pool performance and issues such as connection leaks.
https://www.dynatrace.com/technologies/java-monitoring/jboss/
But still, you do not get the Jboss pool insights at Dynatrace UI. Following points are seen to be generally the cause, hence it is advised to check on these steps.
1. Check if statistics are enabled to monitor at the JBoss side https://access.redhat.com/solutions/268793#EAP63
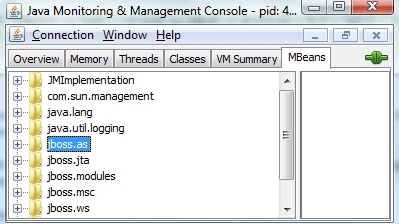
and whether you have the jboss.as domain listed
Example -> jboss.as:subsystem=datasources,data-source=OracleDS
To check list of Mbeans exposed on the server it is easier to grasp it with a tool like Jconsole https://docs.oracle.com/javase/8/docs/technotes/guides/management/jconsole.html
which shows all Mbeans in a list structure.
2. If above point is all fine but still you are not able to see JBOSS connection pool, check whether RBAC is enabled for JBoss i.e. access-control provider="rbac". When RBAC is active on JBoss, certain JMX domains like "jboss.as" are not active, and metrics cannot be reported. See https://access.redhat.com/solutions/3370541
The workaround is https://issues.redhat.com/browse/JBEAP-13845 that is to change the monitoring user at jboss side to "anonymous".
3. Try a restart the process if you had missed to after enabling the extension. If the issue still persists, please do reach out to Dynatrace Support.


