- Dynatrace Community
- Learn
- Troubleshooting
- Why are there gaps in Kubernetes monitoring of a cluster after I change the Kubernetes settings for this cluster?
- Subscribe to RSS Feed
- Mark as New
- Mark as Read
- Printer Friendly Page
- Mark as New
- Subscribe to RSS Feed
- Permalink
22 Dec 2023 09:29 AM - edited 11 Jan 2024 09:13 AM
Short gaps in monitoring of one to two minutes is an expected behavior.
Why does this happen?
When the settings for a Kubernetes cluster change, the old configuration is removed from the ActiveGate, and the system tries to find the most appropriate ActiveGate to monitor the Kubernetes cluster with the new settings. Once the best matching ActiveGate is known, the monitoring with the new configuration starts on the assigned ActiveGate. Depending on the data (different metric types, events, etc.) it may take up to two minutes until monitoring resumes.
Example
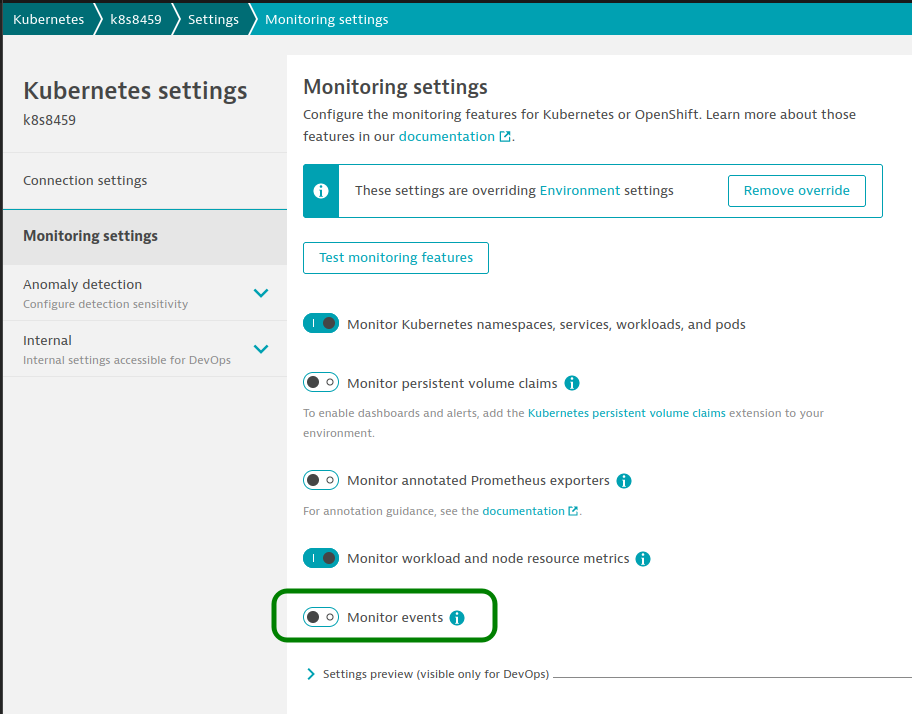
We turn off monitoring events.
With the following command, we can see the change in the monitoring state of the ActiveGate involved. (For this example we have one containerized ActiveGate in the monitored Kubernetes cluster.)
watch 'kubectl logs -n dynatrace k8s8459-activegate-0 2> /dev/null | grep -E "Configuration (added|updated|removed)" | tail -8'
We see that at 11:18 UTC, the (old) monitoring configuration is removed and at 11:19 UTC the new configuration becomes active.
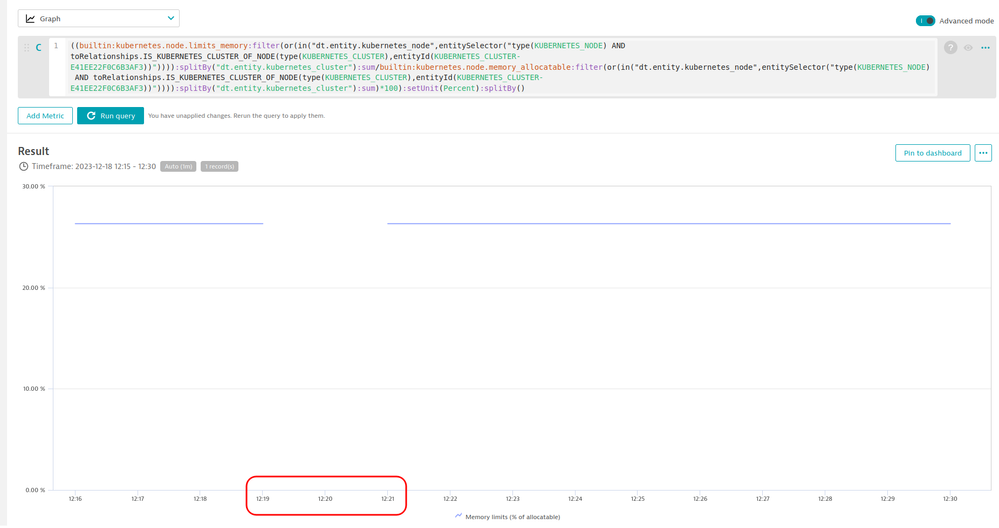
In the data explorer, we can see this gap of two minutes for metrics originating from this ActiveGate (Note: the local time is CET, which is UTC+1)
We're seeing the 'Monitoring not available' alert created for one of our OpenShift clusters. Looking at the data there are large gaps, 14 minutes now from the last datapoint. Others are around 10 minutes. What can we look at to determine the reason for this?
Hi, sivart_89, thank you for this good question. I'd check a few metrics first, to check whether the AG is running smoothly.
- dsfm:active_gate.kubernetes.api.query_duration should be in the milliseconds range, filter by your cluster and split by status_code to find out more. Higher query durations and or status codes other than 200 might indicate a network problem.
- Maybe resources for the monitoring ActiveGate are exhausted. You could check the following jvm metrics. There is no good / bad threshold, but spikes could indicate a resource problem. You could filter them by the ActiveGate ID, which you can find in the Properties and Tags of your monitored K8s cluster.
- dsfm:active_gate.jvm.cpu_usage
- dsfm:active_gate.jvm.heap_memory_used
- dsfm:active_gate.jvm.gc.major_collection_time
- For a containerized AG, you could check container metrics, dt.kubernetes.container_cpu_throttled filtered by the namespace name "dynatrace" and the workloadkind "statefulset" and your cluster would give you the cpu throttling for the AG. Everything below 50mcores is fine here. (I have one load test scenario here, where the AG throttling is 250 mcores. This is rather high, but the AG still works like a charm. Higher values here could indicate a too low cpu request value for the AG, a too low request quota for the namespace, or a generally exhausted K8s node.
BR, PJ.
@Peter_Jelitsch1 thanks for the information. I've checked the below items and do see some throttling but it is very minimal. I've also chatted with Redhat some during our weekly calls with them. One of them said they have seen this occur if for example there is a ton of resources that the api is trying to iterate through. He was wondering if there is any way to further filter down things to understand maybe what api call is trying to pull back a larger than normal amount of resources. Is there anyway of doing this? Or at least to better understand what underlying api calls are being ran by the ActiveGates.
dsfm:active_gate.kubernetes.api.query_duration: For the datapoints we are collecting (because often the connection timesout), they range from 40ms to nearly 3 seconds. I don't see the data at a consistent level like I do with another one of our openshift clusters which is not having the issue. With it the datapoints hover relatively around the same value
dsfm:active_gate.jvm.cpu_usage: On average this hasn't been over 3%
dsfm:active_gate.jvm.heap_memory_used: Some spikes as expected but nothing over 800MB
dsfm:active_gate.jvm.gc.major_collection_time: Mostly <30 ms but I do see 15 mins where it was from 100 - 156ms


