- Dynatrace Community
- Ask
- Alerting
- Custom alert reflecting on dashboards
- Subscribe to RSS Feed
- Mark Topic as New
- Mark Topic as Read
- Pin this Topic for Current User
- Printer Friendly Page
- Mark as New
- Subscribe to RSS Feed
- Permalink
06 Apr 2022 03:12 PM - edited 06 Apr 2022 03:25 PM
I have created a custom alerts for a warning level to a certain team (server admin team) and to be sent by email on the agreed threshold, the challenge here is that whenever these alerts are being triggered it will be reflected to the dashboards (as red cells on hosts) which will confuse my other team (monitoring team).
As these custom alerts are for a warning level only and my monitoring team is monitoring the critical alerts/problems, and they both share the same component so I cant differentiate it using the management zones.
So if I can only send these email alerts without reflecting it in dashboards, or is there any alternative to that ? which other solutions can be applied here ?
I can create a dashboard to represent these alerts in metrics instead of alerted emails but to be honest it will not be our favorite approach.
Thanks,
Solved! Go to Solution.
- Mark as New
- Subscribe to RSS Feed
- Permalink
06 Apr 2022 03:34 PM
Hi @Reef,
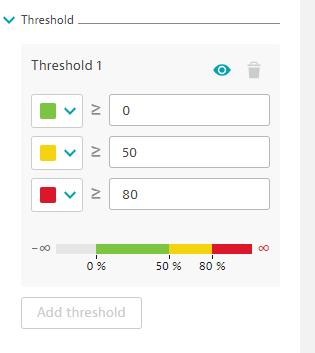
you can use the custom thresholds to define when an entity displayed in a tile goes from healthy to not healthy. You find these in the Data Explorer page on the right hand side
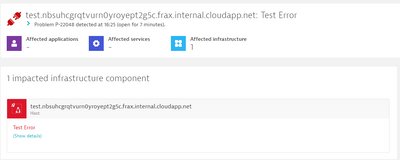
For the purpose of this example I raised an AvailabilityEvent on a Host, and as you can see the Host is still appearing green in the Dashboard although a Problem is currently active on it. The tile metric being used is the CPU Usage %
Hope this helps !
Best,
Mark
Featured Posts


