This website uses Cookies. Click Accept to agree to our website's cookie use as described in our Privacy Policy. Click Preferences to customize your cookie settings.
Alerting
Questions about alerting and problem detection in Dynatrace.
Turn on suggestions
Auto-suggest helps you quickly narrow down your search results by suggesting possible matches as you type.
- Community Home
- Platform
- Alerting
- Re: Custom alerts on Log Monitoring
Options
- Subscribe to RSS Feed
- Mark Topic as New
- Mark Topic as Read
- Pin this Topic for Current User
- Printer Friendly Page
Options
- Mark as New
- Subscribe to RSS Feed
- Permalink
19 Feb 2021 03:39 AM
Hi,
I have configure the string in logs to be monitor as metric (log Event) and created the custom alert with threshold of 1 count for 1min to 3min default.
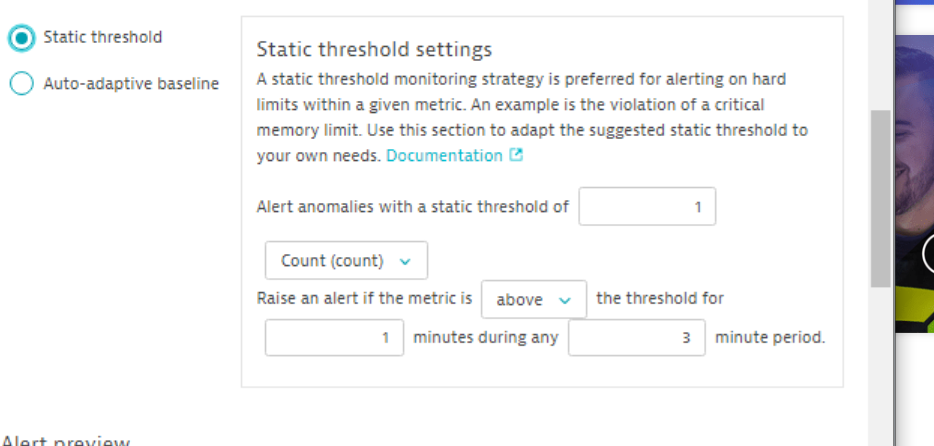
The above static threshold will alerts for each error string occurrence in logs?
Also once the metric is created and added to custom chart it will detect/display the historical (older) log errors?
Solved! Go to Solution.
Labels:
9 REPLIES 9
Options
- Mark as New
- Subscribe to RSS Feed
- Permalink
22 Feb 2021 01:21 AM
Also do we need to need to select the particular log process in scope? if we not selected the scope then what will be the issue?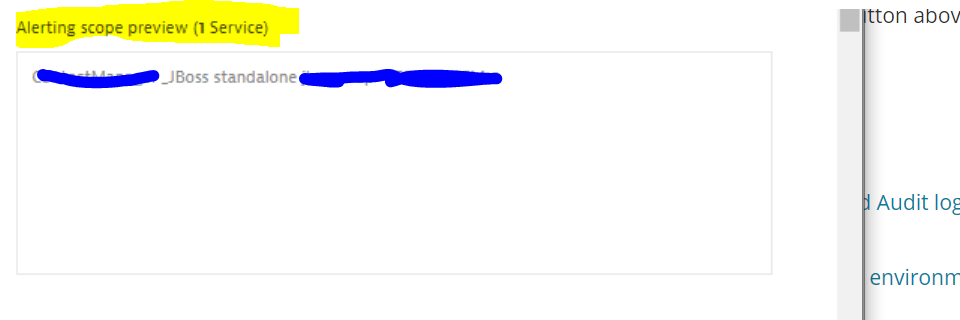
Options
- Mark as New
- Subscribe to RSS Feed
- Permalink
22 Feb 2021 07:23 AM
Hello @Mayana K.
The good practice is to limit the scope, and especially when you are using the calculated metrics.
Regards,
Babar
Reply
Options
- Mark as New
- Subscribe to RSS Feed
- Permalink
22 Feb 2021 07:41 AM
Actually the issue we are facing is, we have configure a log monitoring error with "X" parameter by creating a custom metric.
When ever the error occurs for X parameter, The dynatrace generate a problem with "X error" and "Y error" as well, but we don`t have any reference of "Y error" in logs.
The below steps has performed to configure a alert
- Search for the error in analyze logs and created X error and Y error
- Created custom alerts for X and Y errors with above thresholds.
- Manually updated the X error to log file for testing.
But dynatrace sends a problem with both X and Y description
Options
- Mark as New
- Subscribe to RSS Feed
- Permalink
22 Feb 2021 08:52 AM
Hello @Mayana K.
Did you try to limit the scope?
Are both problems coming from the same logs?
Regards,
Babar
Options
- Mark as New
- Subscribe to RSS Feed
- Permalink
22 Feb 2021 08:57 AM
Yes limited the scope.
And both the error are generating in same problem and coming from the same logs.
Options
- Mark as New
- Subscribe to RSS Feed
- Permalink
23 Feb 2021 07:13 AM
We got the fix.
X error = 'system error failed'
Y error = 'system error failure'
I was using the query to filter the logs as 'system error failed' . This will matching the both X error and Y error.
X error = 'system error failed'
Y error = 'system error failure'
seems this is why we got the alert for both x and Y errors.
I have updated the query as "'system error failed'" then it exactly matching the parameter.
Options
- Mark as New
- Subscribe to RSS Feed
- Permalink
19 Feb 2021 09:58 AM
Concerning historic occurances: No, it counts from the time you defined the pattern.
Featured Posts
