- Dynatrace Community
- Ask
- Alerting
- Do database anomaly detection rules evaluate based on all requests, or on a request by request basis?
- Subscribe to RSS Feed
- Mark Topic as New
- Mark Topic as Read
- Pin this Topic for Current User
- Printer Friendly Page
- Mark as New
- Subscribe to RSS Feed
- Permalink
15 Apr 2019 09:55 PM
Hi team,
My customer filtered down to a particular DB SQL request, in one of our databases, and is wondering why a problem hasn't been created by Dynatrace.
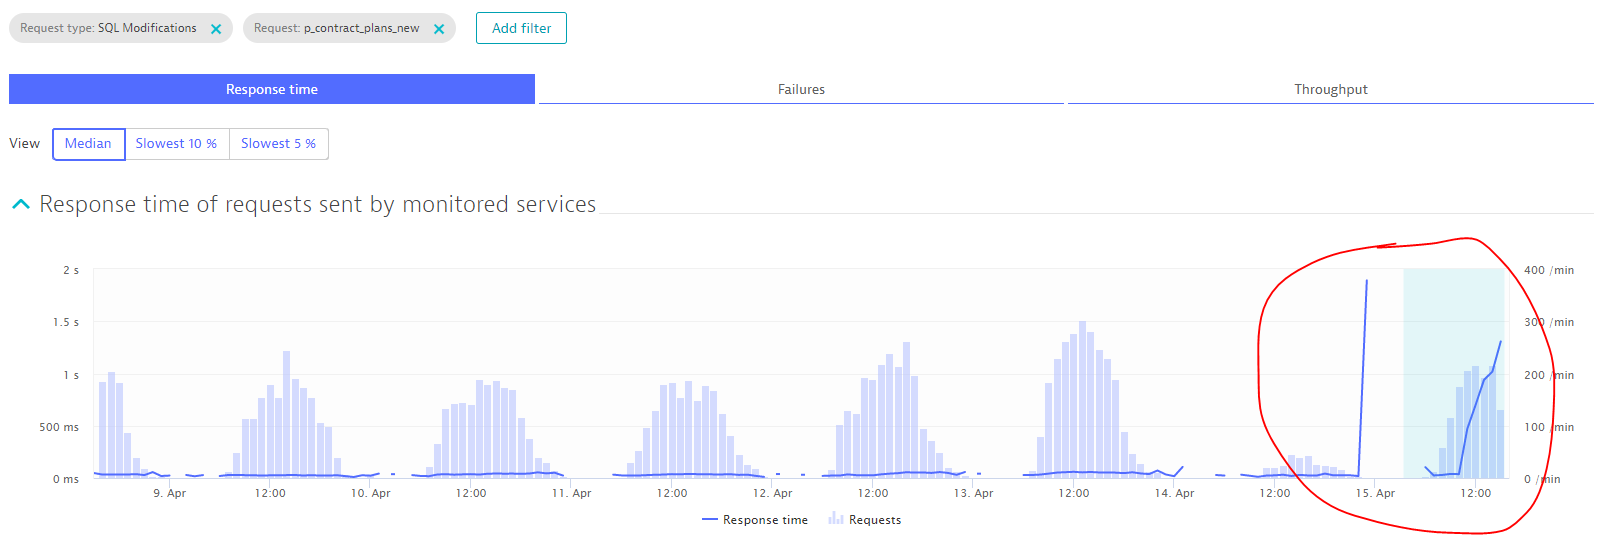
Over the past 7 days the Request is showing typically less than a 50 MS response time. Today that request is showing a climbing response time upwards of 1.3 S. (I am filtered on the request). the request is being executed far more than the 10/min requirement, and has been occurring for a number of hours in the graph below.

The response time rule is set to use the auto-baseline, and to alert if the response time increases by 5 MS or by 50%
Does Dynatrace alert on request level response time problems, or only if the DB service as a whole has a response time problem?
The response time for the requests as a whole hasn't yet reached a 5 MS increase.
Thanks,
Adam Sjoerdsma
Solved! Go to Solution.
- Labels:
-
databases
-
problems classic
- Mark as New
- Subscribe to RSS Feed
- Permalink
16 Apr 2019 04:27 AM
Be sure to post this on slack if you don't get anything, there's a lot more eyes on it there.
Line here says it should be creating a reference value for the different sql statements queried so I'd think it should be for all the queries with enough traffic: https://www.dynatrace.com/support/help/shortlink/problem-evaluation#service-baselining
Also, wouldn't have an impact here but looking through the settings it looks like it would be 5 ms AND 50% not OR. No option I see for OR.
- Mark as New
- Subscribe to RSS Feed
- Permalink
16 Apr 2019 07:24 AM
Dynatrace auto baseline alerts on individual requests, on groups (QUERY, UPDATES, INSERTS) and on the entire service. Please check that the service did run and receive load for at least 20% of a weeks duration. Otherwise alerting is not active due to unstable baselines.
You can find more details about automatic baselines here:
Best greetings,
Wolfgang
Featured Posts
