- Dynatrace Community
- Ask
- Alerting
- Dynatrace not noticing sudden CPU increase
- Subscribe to RSS Feed
- Mark Topic as New
- Mark Topic as Read
- Pin this Topic for Current User
- Printer Friendly Page
- Mark as New
- Subscribe to RSS Feed
- Permalink
30 Mar 2021 11:22 AM
Hello,
we have a Dynatrace SaaS instance monitoring some of our local hosts.
Today at 8.40, the CPU on one of the hosts spiked from 20% (normal usage) to 70% (still is at 70%).
Dynatrace didn't signal anything in the "Problems" section. Why?
I'm attaching a graph of the CPU.
Furthermore, in the Settings->Anomaly detection->Infrastructure, the "Detect CPU saturation on host" setting is active. Maybe 70% is not a sufficient value to trigger an alarm?
Thanks
Solved! Go to Solution.
- Labels:
-
problem detection
- Mark as New
- Subscribe to RSS Feed
- Permalink
30 Mar 2021 11:59 AM - edited 30 Mar 2021 12:00 PM
As you suggested yourself, 70% is not enough to trigger a problem.
You can find the defaults in the documentation. For CPU Usage on a Host it is 95% in 3 of 5 one-minute intervals.
You can change this setting environment-wide, for a host group or a single host.
- Mark as New
- Subscribe to RSS Feed
- Permalink
13 May 2021 03:00 PM
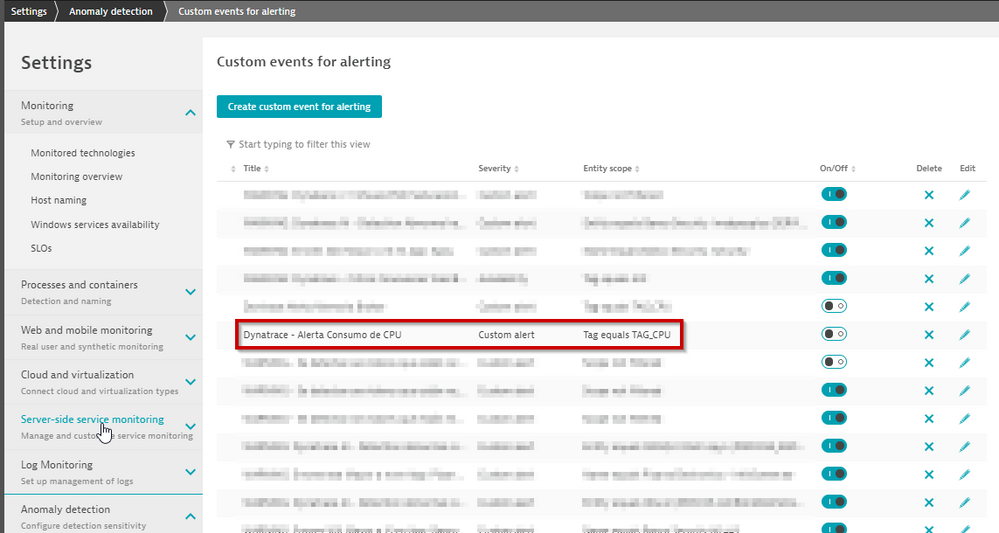
Possibly the conditions for an alert to be generated are not met. You can create your own alerts in which you can define a more sensitive threshold and under the conditions that you want.
Best Regards!
Featured Posts

