- Dynatrace Community
- Ask
- Alerting
- Monitoring of Dynatrace Managed Clusters
- Subscribe to RSS Feed
- Mark Topic as New
- Mark Topic as Read
- Pin this Topic for Current User
- Printer Friendly Page
- Mark as New
- Subscribe to RSS Feed
- Permalink
12 Mar 2019 06:46 AM
Hi
We need to monitor the actual Dynatrace Managed Clusters. We are a 24/7 business and cannot rely on just the email or on our clients, to tell us when a cluster or node is down.
Is there a way that we can monitor this, maybe with the Splunk Integration? We just need to know whether the cluster is available or not & whether the nodes and gateways are available or not. We'd like to put this on a dashboard view so that our incident management teams can have the ability to view this quickly without having to sift through email alerts.
Thanks!
Solved! Go to Solution.
- Mark as New
- Subscribe to RSS Feed
- Permalink
12 Mar 2019 08:33 PM
What we do is exec the actual status and "health" check from an external app running curl every 4 minutes. Alerting if the result is not RUNNING, for activegates and cluster. For cluster we also run the \launcher\dynatrace.sh status.
- Mark as New
- Subscribe to RSS Feed
- Permalink
05 Mar 2020 06:27 PM
@melissa P. this actually exists, Ill create a document up today and attach it.
- Mark as New
- Subscribe to RSS Feed
- Permalink
23 Mar 2020 08:24 PM
we have a blog post in the works on this, sorry for the delay but stay tuned!
- Mark as New
- Subscribe to RSS Feed
- Permalink
24 Mar 2020 11:50 AM
Please can you comment again when the blog post is up. Thank you!
- Mark as New
- Subscribe to RSS Feed
- Permalink
24 Mar 2020 12:20 PM
Will do 🙂 sorry for the delay
- Mark as New
- Subscribe to RSS Feed
- Permalink
12 Oct 2021 02:27 AM
@ChadTurner Any update on the blog?
- Mark as New
- Subscribe to RSS Feed
- Permalink
14 Oct 2021 09:33 AM
Love to hear about the blog post, too 🙂 @ChadTurner any news?
- Mark as New
- Subscribe to RSS Feed
- Permalink
14 Oct 2021 06:54 PM - edited 14 Oct 2021 06:54 PM
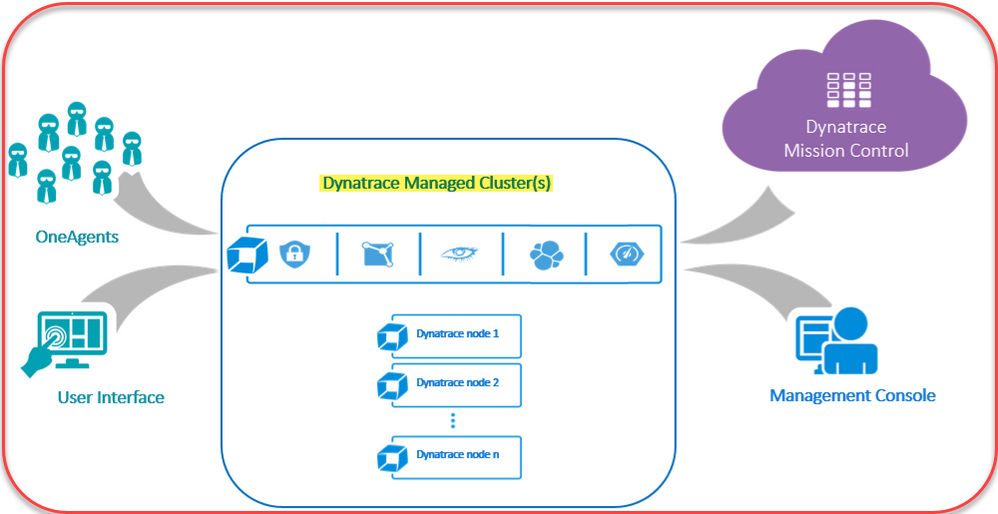
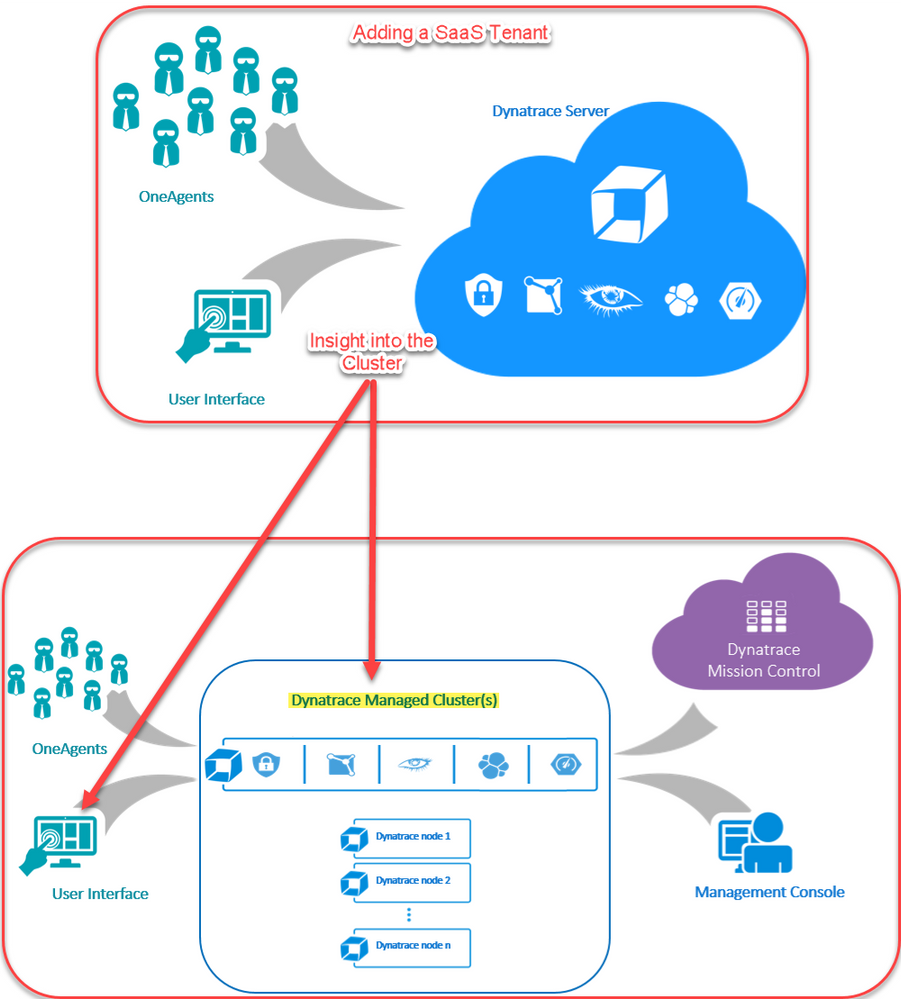
So the blog never made it to publication. But essentially, Managed Customers have the ability (With a Dynatrace One Service Subscription) to have a SaaS cluster that watches your Managed Cluster. Think of it as Dynatrace Monitoring Dynatrace.
Once created, Your SaaS Environment will look at your Managed Cluster as if it were a Monitored Application. This then gives you insight into the number of users using Dynatrace, the dashboards they are using, how long are they using the product, and all the other bells and whistles that you would expect while monitoring your core Business Apps.
Current Managed Set up:
Adding in SaaS monitoring:
- Mark as New
- Subscribe to RSS Feed
- Permalink
27 Oct 2021 04:51 PM
Thanks for the post Chad. I am not completely sure, but I think the Service you mention is the Dynatrace One Premium Service Subscription. For now, I don´t think a SaaS cluster is GA for non-Premium, but definetely something we are working on.
- Mark as New
- Subscribe to RSS Feed
- Permalink
26 Oct 2021 05:43 PM
Melissa I'm not very clear but placing splunk in server dynatarce could have problems with libraries.
I'm not really sure if this happens with the servers. I'll look into it and update you.
best regard
- Mark as New
- Subscribe to RSS Feed
- Permalink
21 Feb 2022 06:08 AM
@melissap , you can try using the splunk infrastructure app . This app can monitor the OS metrics of your managed cluster nodes and activegates (CPU/Memory/disk/uptime) and for dynatrace service health monitoring you can run the custom linux command in the same app.
Featured Posts


