- Dynatrace Community
- Ask
- Alerting
- Re: Paging File monitor
- Subscribe to RSS Feed
- Mark Topic as New
- Mark Topic as Read
- Pin this Topic for Current User
- Printer Friendly Page
- Mark as New
- Subscribe to RSS Feed
- Permalink
25 Mar 2022 01:03 PM
Hi Team,
Is it possible to monitor Paging File in windows server using DT one agent? Interest is , when Page File Name is "_Total" and alert when it's usage breaches threshold of 90%.
Many thanks,
Srikanth Samraj
Solved! Go to Solution.
- Labels:
-
anomaly detection
-
problems classic
- Mark as New
- Subscribe to RSS Feed
- Permalink
25 Mar 2022 07:57 PM
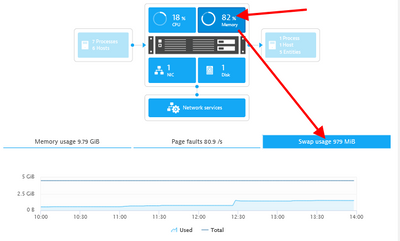
You should be able to get the information that you want at the system level. In the host section, you should select memory and then "Swap usage":
If you want to setup alerts, you should use the metric: builtin:host.mem.swap.used
- Mark as New
- Subscribe to RSS Feed
- Permalink
30 Jun 2023 08:49 PM
Please note, in system admin swap alerting is based on percentage, any chance Dynatrace can make this a calculated metric out of box with percentage value? thanks!
- Mark as New
- Subscribe to RSS Feed
- Permalink
02 Jul 2023 10:44 PM - edited 02 Jul 2023 10:44 PM
Hi,
Since you have these two metrics:
- builtin:host.mem.swap.used
- builtin:host.mem.swap.total
I think you can create your own metric selector event:
(builtin:host.mem.swap.used / builtin:host.mem.swap.total) * 100
Best regards
- Mark as New
- Subscribe to RSS Feed
- Permalink
04 Jul 2023 06:06 PM
Hi Anton. The reason this is not an acceptable solution is because when creating a metric event using this calculation, we get the error "The number of metric dimension values in the last 24 hours (15448) exceeds the limit of 1000. Please refine the filter criteria or use a metric key based query definition." In order to actually set up an alert for our entire environment based on SWAP %, we would need it to be a standalone metric. Please let us know if this is possible.
- Mark as New
- Subscribe to RSS Feed
- Permalink
04 Jul 2023 10:44 PM
Hi,
I do not see another way to do it. You can split scope and creating more than one metric, for example, per host groups.
If not, I would suggest to raise a product idea about it.
Best regards
- Mark as New
- Subscribe to RSS Feed
- Permalink
06 Jul 2023 12:39 PM
Hi,
I've submitted a product idea (30 days ago) to have swap space usage in %.
- Mark as New
- Subscribe to RSS Feed
- Permalink
06 Jul 2023 06:39 PM
That's great! I will vote for it.
- Mark as New
- Subscribe to RSS Feed
- Permalink
04 Jul 2023 05:19 PM
I dis-agree this is resolved, any Unix Admin started their training, the first command to learn is vmstat. everything shows from vmstats is in percentage format from the native Linux OS. even RedHat admin book has it on percentage. All other monitoring tools also monitoring via percentages, we are looking for a percentage presentation as base metric so we can alert on this metric.
- Mark as New
- Subscribe to RSS Feed
- Permalink
28 Jun 2024 11:52 AM
When this option is available in remote agent (remote unix monitor), I don't know why it is a challenge to be made available for hosts.
ext:tech.RemoteAgent.swap_used_percent
Featured Posts

