- Dynatrace Community
- Ask
- Alerting
- Re: Connectivity problem
- Subscribe to RSS Feed
- Mark Topic as New
- Mark Topic as Read
- Pin this Topic for Current User
- Printer Friendly Page
- Mark as New
- Subscribe to RSS Feed
- Permalink
15 Jun 2020
11:05 AM
- last edited on
15 Mar 2023
04:09 PM
by
![]() Ana_Kuzmenchuk
Ana_Kuzmenchuk
Hi all,
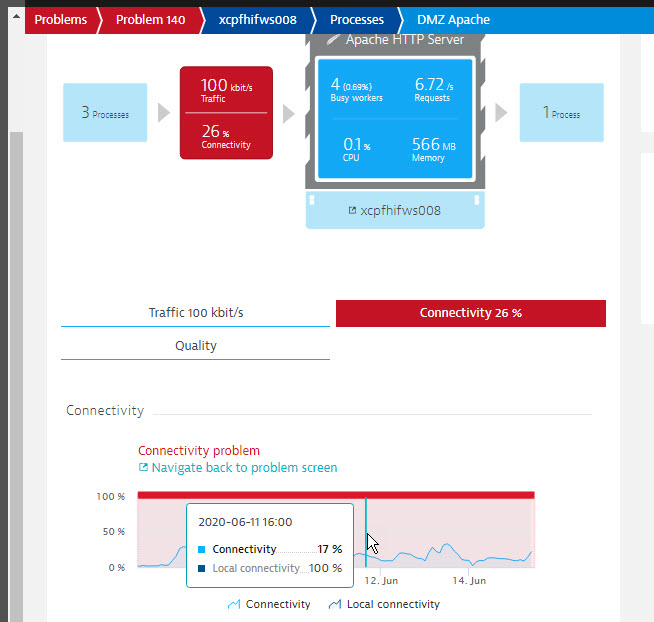
we've two apache processes with a connectivity problem since they are started:

The details only shows a Connectivity problem with the message: "TCP connectivity rate for process DMZ Apache on host xcpfhifws008 has decreased to 0 %"
and this screenshot:


so, what could be the connectivity problem in this apache? We don'nt see in Dynatrece any other details...
Thanks in advance!
Josep Maria
Solved! Go to Solution.
- Mark as New
- Subscribe to RSS Feed
- Permalink
15 Jun 2020 11:11 AM
There are several reasons for Connectivity issues. I would suggest you start with some possibilities that are explained in:
- Mark as New
- Subscribe to RSS Feed
- Permalink
16 Jun 2020 07:57 AM
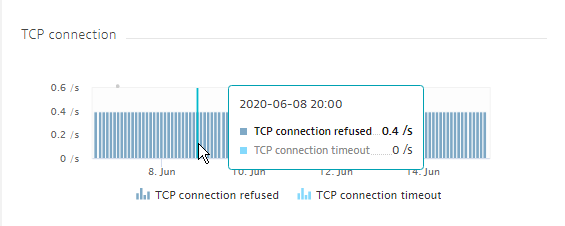
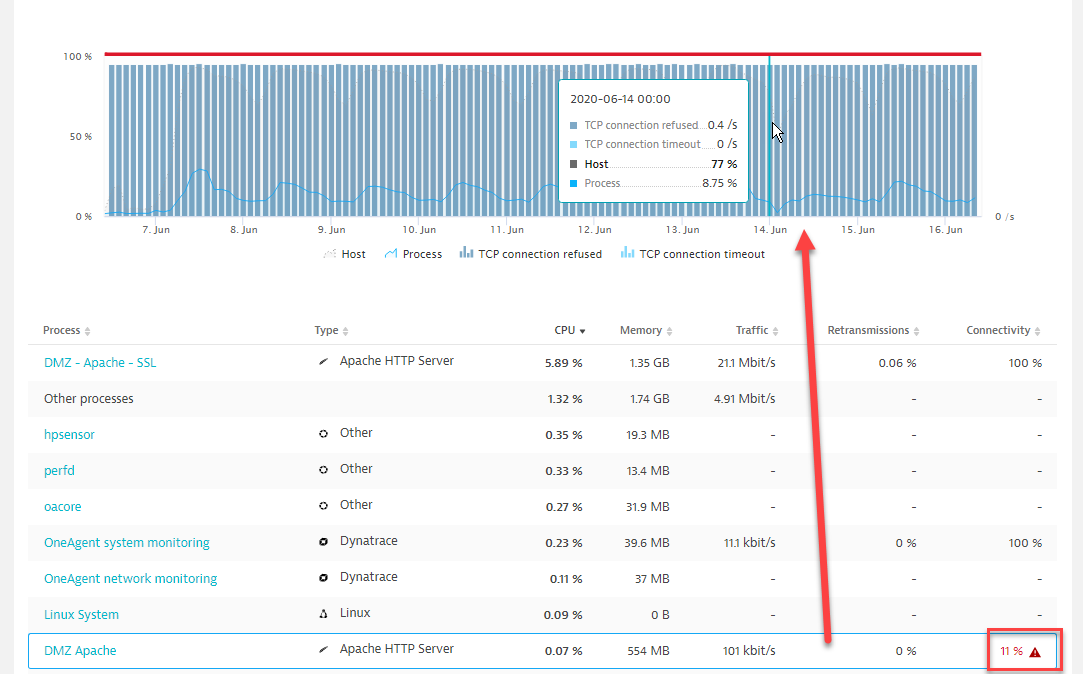
Hi @Antonio S., the details on the problematic Apache process are this: so it seems to be a "Overloaded or poorly configured processes can have trouble accepting new network connections. This results in timeouts or resets of TCP handshakes. Such issues are tracked as TCP connection refused and TCP connection timeout errors. ". So, how can I view what are the attempts of TCP connections reffused by the appache? Regards!
- Mark as New
- Subscribe to RSS Feed
- Permalink
16 Jun 2020 09:06 AM
I would suggest you take a look at:
https://www.dynatrace.com/support/help/how-to-use-dynatrace/networks/detect-network-errors/
- Mark as New
- Subscribe to RSS Feed
- Permalink
16 Jun 2020 10:44 AM
Hi,
yes, I've read this article. So, the TCP connections refused seems to be associated to the Apache processes... With this in mind, can it be ruled out that they were due to connection attempts to a port where there is no process listening?
The key I think is to identify these connection attempts, how can we do it?
- Mark as New
- Subscribe to RSS Feed
- Permalink
16 Jun 2020 12:28 PM
Regarding the first question, it should be related to ports that Apache is listening to. You can see those ports in the process properties.
Regarding the second question, you'll have to use the tools mentioned in the link. There can be many reasons, and security issues normally appear on top. I would say:
- Given it's Linux, issue the following command as root (you might have to change apache if it's running under a different name):
netstat -anp | grep -i apache
You might have to repeat it a number of times.
This will give you the existing connections (ESTABLISHED), the ones that have had the connection finished but is still waiting (TIME_WAIT) and the port that is being listened to (LISTEN). I suspect you will have more of them, and those will probably be involved in the problem.
- Mark as New
- Subscribe to RSS Feed
- Permalink
05 Dec 2023 09:55 AM
Hi,
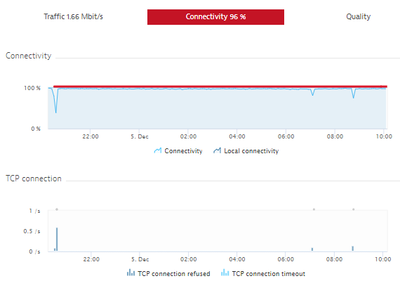
Several times, it happens in our tenant that after the connectivity got recovered, the alert keeps opened for much time (a day or even a couple of days).
As you can see on the screenshot, the connectivy is at 96% but the alert continues opened:
And as it can be also seen in the screenshot, the connectivity was 100% from 22:00 to around 7:00. But the alert continued opened.
Why does the alert keep opened although the connectivity recovered? Is any way to get the alert closed once the connectivity recovers?
Regards,
Elena
Featured Posts

