- Dynatrace Community
- Ask
- Alerting
- Tuning Dynatrace alerts
- Subscribe to RSS Feed
- Mark Topic as New
- Mark Topic as Read
- Pin this Topic for Current User
- Printer Friendly Page
Tuning Dynatrace alerts
- Mark as New
- Subscribe to RSS Feed
- Permalink
23 Mar 2021 08:47 AM
Hello,
we are receiving a lot of false positives from Dynatrace (SaaS), and we want to tune alerting.
Below are two examples:
1) Mobile app
xxxx
Crash rate increase
1 affected users
Application version 5.1.3 is affected by a crash rate increase to 13 %
(we don't want to be notified if just one user is affected)
2)
External web request service
Requests to unmonitored hosts
Failure rate increase
124 requests/min impacted
by a failure rate increase to 1.93 %
Service method: xxxxxx
We want this alert to trigger only if the failure rate is above 10% or more.
Where are those parameters tuned? My guess is:
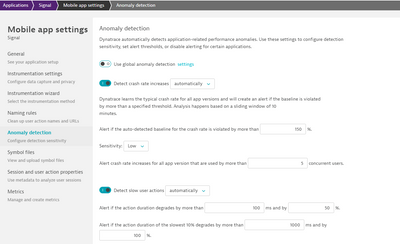
1) settings->anomaly detection->applications->mobile apps->detect crash rate increase
2) settings->anomaly detection->services->detect increase in failure rate
An explanation on how those (if correct) work would be great.
Thanks
- Mark as New
- Subscribe to RSS Feed
- Permalink
23 Mar 2021 12:53 PM
Those settings will do it but they are the global environment level settings so apply to all applications using the environment global settings. You can use those but you can also access application/service level settings by navigating to that entity's page in the UI and accessing the edit/setting there.
The affected user count doesn't actually trigger a problem event it's the crash rate itself calculated by version, the affected user count just adds context and is normally more of an informed estimate than a hard number. 'Automatically' means a learned dynamic baseline is used for detecting problems by app version so you can adjust this to make it more or less sensitive in various ways. You can switch that to use a fixed threshold but then it is no longer going to be baselining.
Similarly, you wouldn't want to adjust the settings for the services in the global settings you can do that per service as well and the same 'Automatically' -> dynamic baseline applies there as well. "Requests to unmonitored" hosts is a special bucket of requests though and includes traffic going to all endpoints not monitored by a OneAgent using a private IP address (public IP addresses would fall under "Requests to public networks." So understand that this affects quite a bit. You may want to split certain important requests that are under unmonitored hosts into their own service before adjusting settings. This can be done through things like custom devices or using the service detection API.
This page has some details on thresholds: https://www.dynatrace.com/support/help/how-to-use-dynatrace/problem-detection-and-analysis/problem-d...
You can also use custom metric events instead of/in addition to these built in types of events: https://www.dynatrace.com/support/help/how-to-use-dynatrace/problem-detection-and-analysis/problem-d...
- Mark as New
- Subscribe to RSS Feed
- Permalink
26 Mar 2021 01:56 PM
Hello,
I managed to adjust the failures vs umonitored hosts (now Dynatrace is a lot less verbose); I'm tackling the "Mobile app crash rate increase" thresholds now.
We are receiving emails like this one:
Crash rate increase
7 affected users
Application version 4.4.26 is affected by a crash rate increase to 4.35 %
but the configuration is saying:
Alert if the auto-detected baseline for the crash rate is violated by more than 150%.
(Applications->[app name]->Mobile app settings->Anomaly detection)
So why are we receiving an alert if the increase is 4.35%?
Thanks
Featured Posts

