- Dynatrace Community
- Ask
- Automations
- Metric for sum of problem durations
- Subscribe to RSS Feed
- Mark Topic as New
- Mark Topic as Read
- Pin this Topic for Current User
- Printer Friendly Page
- Mark as New
- Subscribe to RSS Feed
- Permalink
16 Jan 2024
08:47 AM
- last edited on
17 Jan 2024
07:58 AM
by
![]() MaciejNeumann
MaciejNeumann
Hi
I was wondering if it is possible to track the sum of problem card duration for specific alerting profiles or services?
If for example I have a database with frequent response time degradations, and I want to know to sum of minuttes/hours problem cards was raised in a fixed range of time.
Can I in any way display this in Dynatrace? I know I can create a SLO and get percentages, but I'm interrested in duration.
Currently I get the data from ServiceNow integration where I then create reports in display the sum of resolution time on a dashboard. But it would be cooler to simply display in Dynatrace.
Problem 1: 20 minuttes
Problem 2: 11 minuttes
Problem 3: 37 minuttes
Sum would be 1 hour and 8 minuttes. Can I display that?
Solved! Go to Solution.
- Labels:
-
metrics
-
problems classic
-
slo
- Mark as New
- Subscribe to RSS Feed
- Permalink
16 Jan 2024 11:02 AM - edited 16 Jan 2024 11:05 AM
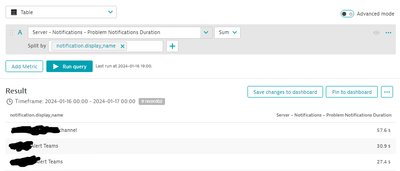
You can do that for notification channels as shown above 🙂
So now I have the sum of all problem durations for a specific alerting profile pushed to a specific Teams account for example.
Or you use the advanced mode:
dsfm:server.notifications.problem_notifications_duration:splitBy("notification.display_name"):sum:sort(value(sum,descending)):limit(20)
Now you can still add filters ofc if you only want to see it for one integration and maybe also use the single value visualization.
- Mark as New
- Subscribe to RSS Feed
- Permalink
16 Jan 2024 11:26 AM
Hi
Thank you for the provided input. Sadly the math does not add up.
I can find a problem notification group I have set up with the alerting profile in question. But when I use the metric you suggest, the numbers returned does not equal the amount of minuttes these problems was open. It returns values way less than the actualy duration of the problem.
Best regards
- Mark as New
- Subscribe to RSS Feed
- Permalink
16 Jan 2024 12:18 PM
You are right, apparently this is the description of the metric.
= The problem notification sending duration (time between sending the notification and receiving a response).
So nice to have but not really what we want :(. Out of the box there does not seem to be a dsfm metric for this.
- Mark as New
- Subscribe to RSS Feed
- Permalink
16 Jan 2024 12:58 PM
As @marina_pollehn stated the metrics is really only for the duration of the alert triggering with your alert integrations as defined. Also keep in mind the default aggregation of the metric is set to "average". You'd really need to create a metrics that pulls the start and end time from the problem card via the Problems V2 API and then formulate it as a metric that you can then target.
You can also always toss in a RFE to request this functionality in Dynatrace 🙂
- Mark as New
- Subscribe to RSS Feed
- Permalink
16 Jan 2024 01:15 PM
Thank you for the input, I'll look into the API suggestion. If I had a dollar for everytime I was pointed towards an RFE, I would be a rich man.. or at least be able to buy a decently sized ice cream 😀
Featured Posts

