This website uses Cookies. Click Accept to agree to our website's cookie use as described in our Privacy Policy. Click Preferences to customize your cookie settings.
Automations
All questions related to Workflow Automation, AutomationEngine, and EdgeConnect, as well as integrations with various tools.
Turn on suggestions
Auto-suggest helps you quickly narrow down your search results by suggesting possible matches as you type.
- Dynatrace Community
- Ask
- Automations
- Re: SLO functions are not showing any data in the latest environment of Dynatrace
Options
- Subscribe to RSS Feed
- Mark Topic as New
- Mark Topic as Read
- Pin this Topic for Current User
- Printer Friendly Page
SLO functions are not showing any data in the latest environment of Dynatrace
Options
- Mark as New
- Subscribe to RSS Feed
- Permalink
18 Apr 2024
06:39 AM
- last edited on
18 Apr 2024
08:22 AM
by
![]() MaciejNeumann
MaciejNeumann
I have a SLO defined which measures success rate of a certain service. It is defined like this,
(100)*(builtin:service.keyRequest.errors.server.successCount:filter(in("dt.entity.service_method",entitySelector("type(~"SERVICE_METHOD~"), entityId(~"SERVICE_METHOD-08EFCF745AD0CF3E~")"))):splitBy())/(builtin:service.keyRequest.count.server:filter(in("dt.entity.service_method",entitySelector("type(~"SERVICE_METHOD~"), entityId(~"SERVICE_METHOD-08EFCF745AD0CF3E~")"))):splitBy())
I have created a dashboard in the classic dashboard from the output of this query.
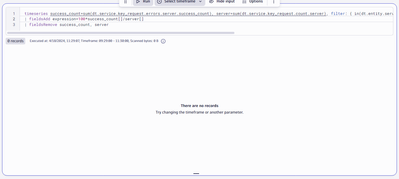
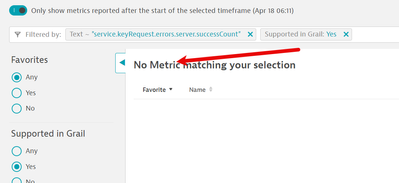
but when exporting this to latest dynatrace environment, it is not showing any data.
this is the DQL code
timeseries success_count=sum(dt.service.key_request.errors.server.success_count), server=sum(dt.service.key_request.count.server), filter: { in(dt.entity.service_method, classicEntitySelector("type(\"SERVICE_METHOD\"), entityId(\"SERVICE_METHOD-08EFCF745AD0CF3E\")")) }
| fieldsAdd expression=100*success_count[]/server[]
| fieldsRemove success_count, server
Also, how to show the SLOs in latest Dynatrace environment . It was very easy to integrate SLOs into the classical dashboard
Labels:
- Labels:
-
slo
1 REPLY 1


