- Dynatrace Community
- Ask
- Cloud platforms
- Re: The difference in metrics for VM's on Azure
- Subscribe to RSS Feed
- Mark Topic as New
- Mark Topic as Read
- Pin this Topic for Current User
- Printer Friendly Page
- Mark as New
- Subscribe to RSS Feed
- Permalink
20 Mar 2023
07:17 PM
- last edited on
13 Jun 2023
03:10 PM
by
![]() Michal_Gebacki
Michal_Gebacki
Hi,
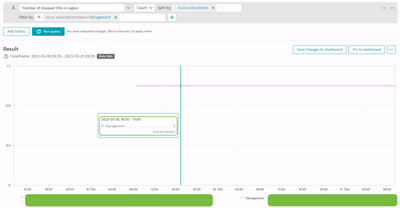
I'm having trouble understanding the data presented based on metrics from Azure. I have created a custom view where I have a chart with the metric "Number of stopped VMs in region". As you can see, for Subscription Management today this metric was changing. I have the same data in the Azure console.
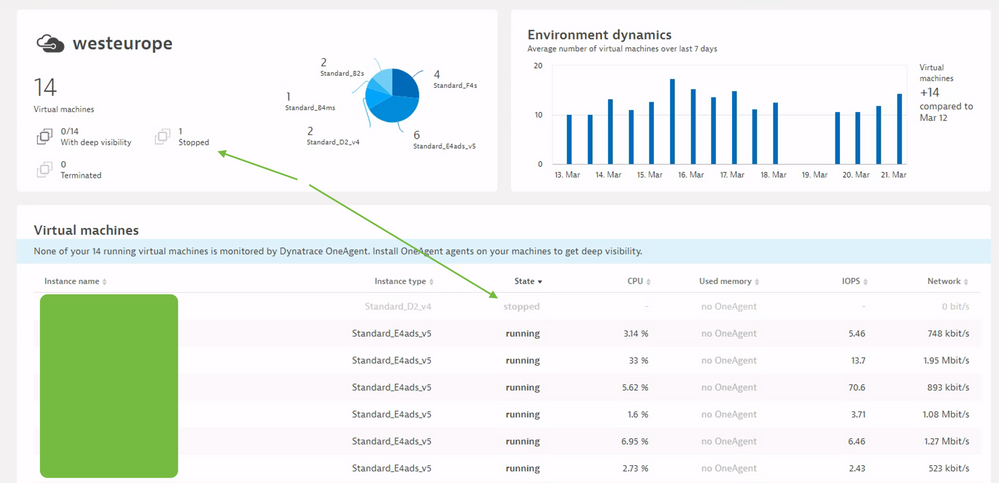
On the other hand, if I switch to the built-in subscription view I see that only one VM was stopped today. I'm wondering if I'm misunderstanding something or is this a bug on the DT side?
Regards,
Radek
Solved! Go to Solution.
- Mark as New
- Subscribe to RSS Feed
- Permalink
21 Mar 2023 05:59 AM
Hi @radek_jasinski,
Have you tried change the aggregation type from auto to another types? It helped me in different use cases, not especially at Azure monitoring.
Best regards,
Mizső
- Mark as New
- Subscribe to RSS Feed
- Permalink
21 Mar 2023 08:46 AM
Hello,
Thank you Mizső for your reply.
I tried to change the aggregation from auto to count. Unfortunately I still have a difference in this metric between these dashboards. I also looked at other aggregations and timeframes, but never managed to achieve the same value as on the built-in view.
Radek
- Mark as New
- Subscribe to RSS Feed
- Permalink
24 Mar 2023 01:08 PM
Hi @Mizső ,
I have confirmation from support that it is an error in the presentation of data. R&D is working on a solution to this problem.
Radek
- Mark as New
- Subscribe to RSS Feed
- Permalink
24 Mar 2023 01:40 PM
Hi @radek_jasinski ,
Thanks for sharing this information.
Have a nice weekend.
Best regards,
Mizső
Featured Posts


