- Dynatrace Community
- Community
- Community challenges
- Re: Take the Tracing Fan Challenge! 💚
- Subscribe to RSS Feed
- Mark Topic as New
- Mark Topic as Read
- Pin this Topic for Current User
- Bookmark
- Follow
- Mute
- Printer Friendly Page
Take the Tracing Fan Challenge! 💚
- Mark as New
- Bookmark
- Follow
- Mute
- Subscribe to RSS Feed
- Permalink
14 Feb 2023
01:13 PM
- last edited on
24 Feb 2023
10:44 AM
by
![]() Ana_Kuzmenchuk
Ana_Kuzmenchuk

On Valentine’s Day one year ago, we asked you to share the Dynatrace features you love, and received so much astonishing feedback in response! This time, we're returning to explore Dynatrace user stories from a bit different perspective! ❤️
Share your unique use cases for Dynatrace's Trace Intelligence tools, such as TraceView, ResponseTimeAnalysis, MethodHotspots, MemoryAllocations, ServiceFlow, and FailureAnalysis. What do you like the most? Did it help you to find a critical bug in your software? Did you get information about something critical? We’d like to hear it! ![]()
And this month, we’ve joined forces with @josef_schiessl and his team, preparing something special for you! Every participant will receive the usual 100 bonus points and a unique “Tracer” forum badge, but, additionally, the top three use cases (shared before March 10th) of our development team’s choice will get 1 x $75, and 2 x $50 gift codes to utilize in the Dynatrace Swag Store!
Looking forward to your great use cases!
- Labels:
-
community challenge
- Mark as New
- Bookmark
- Follow
- Mute
- Subscribe to RSS Feed
- Permalink
15 Feb 2023 03:07 PM
Hello everyone! ![]()
As an initiator of this challenge, I want to actually also contribute / kick it off now 🙂
A cool thing about developing our tracing tools is that we can actually use them ourselves!
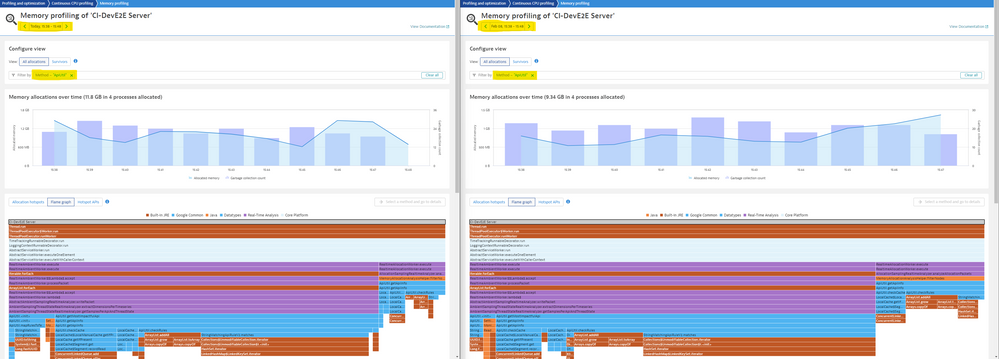
One of my favourite tools is the memory analysis (heres a recent very interesting blog post about it).
Whenever we touch any code that is highly critical from a performance standpoint, we always make sure to compare the before and after using memory analysis.
We use the "method" filter and put the class name or package where the changed happened to only analyze the memory consumption of our change. Tip: The "method filter" can filter for packages, classnames and even methods.
Sometimes very small changes in the code / adaptions can lead to lots of allocated heap / performance loss. On the other hand sometimes refactorings might not have any impact on heap because you never know what the JVM does behind the scenes when it executes the code.
Its awesome to compare the raw numbers but also see how the flamegraph changes.
Looking forward to hearing about your usecases / tips and tricks!
Cheers,
Josef
- Mark as New
- Bookmark
- Follow
- Mute
- Subscribe to RSS Feed
- Permalink
23 Feb 2023 07:38 PM
Thanks for sharing this. I think this is another one for the category "Tips & Tricks". If you are up for it lets record a session on how to properly use the Memory Profiler!!
- Mark as New
- Bookmark
- Follow
- Mute
- Subscribe to RSS Feed
- Permalink
15 Jun 2023 03:06 PM
Happy to see this challenge result in another awesome collaboration!
Sharing the final product of it with the Community:
- Mark as New
- Bookmark
- Follow
- Mute
- Subscribe to RSS Feed
- Permalink
15 Feb 2023 05:04 PM
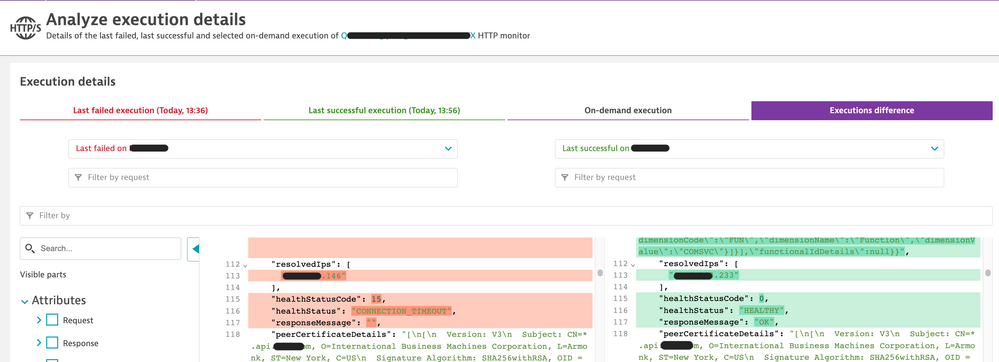
In my case was a new feature introduced few weeks ago in Synthetics, where we can now compare, side by side, the execution results of 2 different locations or status, and point out their differences easily.
This feature helped me to find out the reason of too many inconsistent execution result from different monitors to an external application not managed by the client, where his app is hosted.
Checking the executions result, I could point to a bad IP from the hosting DNS Load Balancer. We have then opened a ticket to hosting service, which confirmed the IP issues after our investigation and finally have fixed their services.
That's pure AIOps, where AI stands for Actionable Insights.
That's really useful data, meant to help and guide troubleshooting.
- Mark as New
- Bookmark
- Follow
- Mute
- Subscribe to RSS Feed
- Permalink
23 Feb 2023 07:36 PM
Oh man. I wasnt aware of that synthetic enhancement! We should do a Tips & Tricks session!!
- Mark as New
- Bookmark
- Follow
- Mute
- Subscribe to RSS Feed
- Permalink
15 Feb 2023 06:02 PM
All of the tools are great! So many I could say, but just the first that came to mind:
I have a client that has machines where you can pay and get a receipt. Lately clients were complaining it was slower. Quickly, traces showed a big 5 second gap, each! Very rapidly Method Hotspots revealed the culprit: a sleep(5) left in the code, in a recent deployment! Immediate fix and immediate improvement of response time!
- Mark as New
- Bookmark
- Follow
- Mute
- Subscribe to RSS Feed
- Permalink
23 Feb 2023 07:13 PM
What a story. While its great to see Dynatrace can capture this I would advocate for also using static code scanning tools in CI to detect artificial sleeps 🙂
- Mark as New
- Bookmark
- Follow
- Mute
- Subscribe to RSS Feed
- Permalink
15 Feb 2023 08:57 PM - edited 15 Feb 2023 08:57 PM
So I have two unique use cases of Dynatrace and the traces and Service flows. THe first one has been turned into a blog post so you might have read it: https://www.dynatrace.com/news/blog/staying-ahead-of-your-competition-with-dynatrace-synthetics/
Using Synthetics to test your competitors. At a previous employer we started to synthetically test our direct competitors. We were a insurance company that wrote homes, renters and auto. We tested a director competitor to record and track the customer experience to see if we provide a faster and better quality experience/service at login. Now if we failed to beat the competitor, we then had that service flow and tons of transaction data surrounding that test which we could adopt at the organization.
Using backtracing Via SmartScape to validate Application ownership. It saddens me to say this but man many times when we onboarded a new set of hosts the application owners/requestors had no idea what their front facing app was, let alone their URL. If a user did have that information it also tended to be incorrect as the URL had changed or they were just totally wrong about it. Management came to us and said we are paying for Dynatrace, YOU need to tell me what their app URL is because we cant rely on the customer knowing it. That night when i should have been sleeping i racked my brain over and over again. How can we work it backwards from the URL to the Hosts, and that's when it hit me. Use all the metric data that Dynatrace has, all the relationships and work it back via Smartscape. So I went to the catch all - My Web App, and started to break out these domains as their own app. I prefixed the URL with my name so I could have a bunch broken out but filter on my name "chad - <URL>". Once it was broken out as its own Application we let it have some time to collect user sessions, then we went to smartscape and looked back to the Services level, from there we could see the metadata and tags in which were populated from host down to the processes down to the services. Not only did this allow us to be proactive and self reliant, but it also gave us 100% certainty that this App belongs to this host/HostGroup/Management Zone. Management was very please and strengthened our tooling at the organization as Dynatrace was a single point of truth by laying the direct relationships based off the actual communication and not something that a human made in Visio.
- Mark as New
- Bookmark
- Follow
- Mute
- Subscribe to RSS Feed
- Permalink
16 Feb 2023 03:43 PM
What a solid piece of a complex user journey, sounds like a great source of inspiration!
- Mark as New
- Bookmark
- Follow
- Mute
- Subscribe to RSS Feed
- Permalink
23 Feb 2023 07:35 PM
I remember writing that blog post with you 🙂
- Mark as New
- Bookmark
- Follow
- Mute
- Subscribe to RSS Feed
- Permalink
15 Feb 2023 10:36 PM
My story:
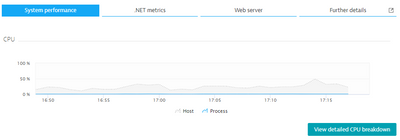
Our team was brought in to troubleshoot high CPU on a server. Dynatrace was immediately blamed for high CPU. Don’t we always get blamed? Many were on the call trying to figure out with no luck.
I told the team to let me look. Within a few minutes I figured out the issue. What did I do?
I went to offending process then went to “View detailed CPU breakdown”
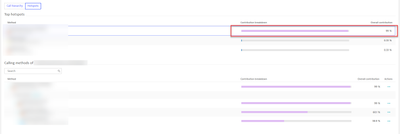
Next, I look at highest CPU usage and went to Method HotSpots
Then went to Hotspots and found that a logging application was causing high cpu, not Dynatrace. Go figure.
It is fun to show the power of Dynatrace.
- Mark as New
- Bookmark
- Follow
- Mute
- Subscribe to RSS Feed
- Permalink
16 Feb 2023 09:26 AM
We love to see Dynatrace shine a light on the true root cause! 💪 Thanks for sharing!
- Mark as New
- Bookmark
- Follow
- Mute
- Subscribe to RSS Feed
- Permalink
21 Feb 2023 03:06 PM
Yes, love how Dynatrace proved it wasn't Dynatrace and it was another app.
- Mark as New
- Bookmark
- Follow
- Mute
- Subscribe to RSS Feed
- Permalink
23 Feb 2023 07:34 PM
Hey Kenny. Great to see those examples - well - great might be the wrong word as in 2023 I havent expect seeing logging as the main performance issues in apps. Just curious. Was this due to a bad logging framework? Or did somebody turn on debug logging under heavy load?
- Mark as New
- Bookmark
- Follow
- Mute
- Subscribe to RSS Feed
- Permalink
23 Feb 2023 08:47 PM
Hey, logging misconfig on the app side.
- Mark as New
- Bookmark
- Follow
- Mute
- Subscribe to RSS Feed
- Permalink
20 Feb 2023 09:51 PM - edited 20 Feb 2023 09:56 PM
Hi Folks,
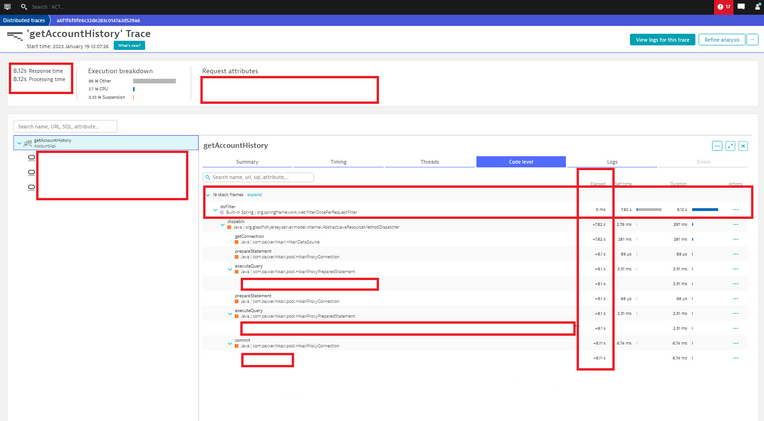
I really love use Dynatrace for dig into the traces. My recent story with traces was a rescue of a project (watermelone project - three weeks before the release was green, two weeks before the release was yellow, one week before the release was full red. 😉). So one week before the release the BAs and developers found me becasue there were huge performance issues (huge response times) at a new green field kubernetes app. Quickly I checked a random individual trace between two meetings:
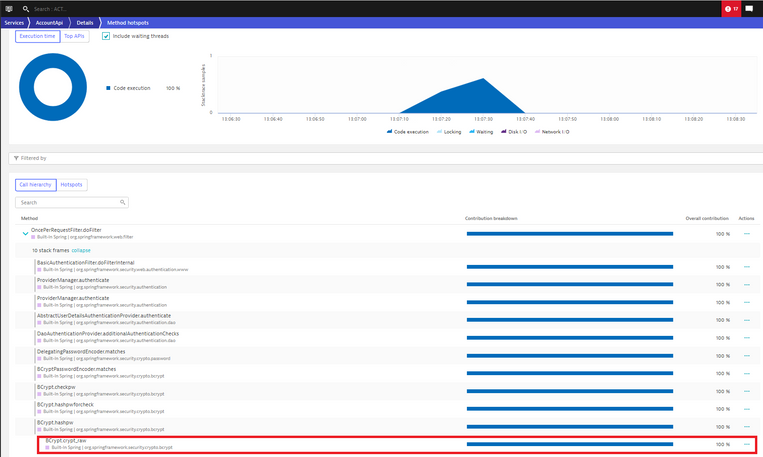
I immadiately checked the method hotspots and in the call hierarchy the bcrypto indetified as a source of the huge response time at this single request:
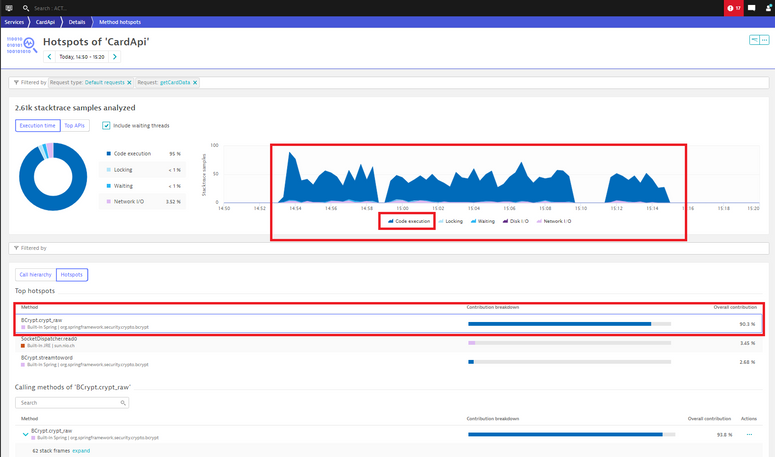
Then I asked the projects to generate load on the services and my first observation was perfect (Dynatrace observation). At each services I could see code execution perfromance issues becasue of the bcrypto during the whole load.
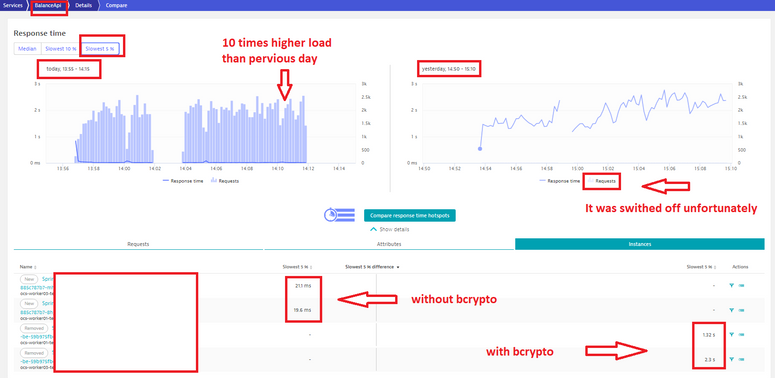
After that the bcrypto was replaced by developers there were new perfromance tests. These performance tests were checked quickly in DT again with compare function:
So the project, the release was saved becasue received the green light in time thanks to DT (and to me 😉).
Best regards,
Mizső
- Mark as New
- Bookmark
- Follow
- Mute
- Subscribe to RSS Feed
- Permalink
21 Feb 2023 08:16 AM
Impressive workaround, thank you @Mizső for so much details!
- Mark as New
- Bookmark
- Follow
- Mute
- Subscribe to RSS Feed
- Permalink
22 Feb 2023 10:28 AM
A watermelon project? 🍉 Love it! Thank you for taking time to share it with us in such a detail!
- Mark as New
- Bookmark
- Follow
- Mute
- Subscribe to RSS Feed
- Permalink
23 Feb 2023 07:33 PM
Wow. I have seen plugins like this in the past that either consume all the CPU for doing tasks that might not be necessary - OR - that are simply configured wrong and can only handle a small amount of concurrent requests. Thanks for sharing. I am curious though -> why was this library added in the first place? Was it by accident? or was there a real reason for adding this crypto hashing algorithm?
- Mark as New
- Bookmark
- Follow
- Mute
- Subscribe to RSS Feed
- Permalink
24 Feb 2023 11:08 AM
Hi Andi,
Devs did not add this plugin by accident. I am not a dev but as fas as I understand this plugin was used at a rest api authentication pw hash generation. Simply they replaced the rest api authentication method after (pleasant secret) DT identified this guilty plugin. 😉
Mizső
- Mark as New
- Bookmark
- Follow
- Mute
- Subscribe to RSS Feed
- Permalink
21 Feb 2023 08:55 AM - edited 21 Feb 2023 09:43 AM
Hi everyone.
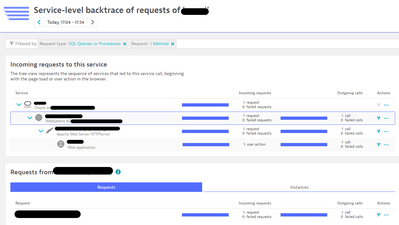
I like Dynatrace's Backtrace feature. Requests to the DB often result in Response time hotspots. The Backtrace feature allows you to trace back from slow SQL statements all the way back to Useractions. Application development members and DB administrators will share this information and proceed with troubleshooting.
Toshimasa Shirai.
- Mark as New
- Bookmark
- Follow
- Mute
- Subscribe to RSS Feed
- Permalink
21 Feb 2023 09:09 AM
Great choice to highlight! Big thanks Toshimasa for your reply, it's truly enriching this thread!
- Mark as New
- Bookmark
- Follow
- Mute
- Subscribe to RSS Feed
- Permalink
23 Feb 2023 04:22 PM - edited 27 Feb 2023 05:15 PM
This one's made for me: I'm a true Tracing Fan! ![]()
As far as Observability Pillars go, Tracing is absolutely the best one ❤️
I got to know Tracing long before I knew Dynatrace: from my academic times, when I was doing my Master's Thesis on OpenTelemetry ![]()
Back then, all of Tracing was manual for me: instrument application code to create trace, setup context, create root span, create child spans, end spans, end trace, send tracing info to X, ... 🔨🔨🔨
When I first saw Dynatrace, and saw Automatic Tracing with so much detail, with no effort at all... I mean, like magic 😍
I think this generational leap really makes you treasure and appreciate the massive load of work that Dynatrace gets out of your way!
On the other hand, beginning with an open-source and manual approach also brought me the base knowledge to leverage Dynatrace's tracing capabilities at its fullest: it helped me to avoid being overwhelmed with so many great information, as I already knew what I was looking for 🔎
Speaking of leveraging Dynatrace's tracing capabilites (there are so many!), a funny story that I remember was of a client who was complaining of Service A when it invoked Service B, regardless of Service B showing pretty fast response times.
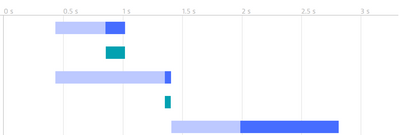
When we looked at the trace examples, we immediately saw what was going on: indeed Service B had fast Server-Side Response Time, but - from Service A perspective - there was a VERY long Client-Side Response Time!
Unfortunately, I do not have screenshot on me of what exactly happened at the time, but I found something similar on another post:
What was great is that no significant analysis was needed to point us on the right way: we just saw the huge difference between the whole span bar (light blue + dark blue) and only the Server-Side response time (only dark blue), because of the great Client-Side Response time (light blue) overhead.
This was only possible, at least in such a simple way, because of Tracing: instead of just having the Response Time from Service A and Service B, we got traces from Service A that showed us when the request was sent out, when did it reach Service B, when did Service B sent out the response and when did that response reached Service A again!
Knowing this, we immediately suspected of a network issue and, after some investigation we were right: a request from Service A to Service B would travel through a hugely inneficient route, instead of going straight to the final destination, which lead to a huge network time overhead.
This was why Client-Side Response Time (Server-Side + Network Time), as seen from Service A, was a lot greater than the Server-Side Response Time reported by Service B itself: Service B handled the request and sent out a response very quickly, it was the travel time between the two that was causing impact.
Think about the amount of data you would have to go through to figure this one out without Tracing! ![]()
- Mark as New
- Bookmark
- Follow
- Mute
- Subscribe to RSS Feed
- Permalink
23 Feb 2023 07:28 PM
Great story and a great reminder that there is a lot going on when a request leaves one service until it makes it to the other service.
What I have seen in my life of analyzing PurePaths is that - while the network is most likely to blame in the scenario above - it might also be other components that are not part of the trace, e.g: serializing or deserializing the data package (also called marshalling). Or - there might be component such as queues between A and B which end up delaying message delivery. This is why its always important to ask about which components you have in a distributed systems and how can you monitor them. For network or other components such as queues you can look at key metrics such as throughput, package loss or queue length
Keep up the great work and please keep sharing those stories
- Mark as New
- Bookmark
- Follow
- Mute
- Subscribe to RSS Feed
- Permalink
24 Feb 2023 10:50 AM
Wow, thank you for sharing this great story with us, and also for taking us back to your pre-Dynatrace times!
- Mark as New
- Bookmark
- Follow
- Mute
- Subscribe to RSS Feed
- Permalink
24 Feb 2023 04:42 AM
This is the story of a great great project... ![]()
![]()
The reality: The client (a global financial institution) needed to improve the experience of its users since the current time to reload a card used for urban transport took approximately 2 minutes, with the wind in favor and assuming no there were other drawbacks. ![]()
The Drama: Local Fintechs were achieving very agile results that, to the detriment of the institution, were losing market share. Although the reengineering of the application was general, this was a pain point for many users. It is taken as a witness case. 💣
The objective: The objective that had been assigned to us was to reduce this process to no more than 20 seconds, with a user experience measured in apdex of 0.98 or higher. 😵
The Question: Can a dinosaur , to avoid extinction, transform into an agile and fast gazelle? ![]()
Wizard's Bag: We used all available Dynatrace tools at our fingertips: Purepaths, Mobile instrumentation, Hotspots, USQL, Session Replay, geolocation info, synthetics, just to name a few. ![]()
The community: In an interdisciplinary team, developers, marketing, testers, ux designers, users. My role was SME of the Dynatrace tool, it was one of the most beautiful jobs that I had to do with Dynatrace and with an excellent human group.![]()
To prevent spoilers, the following video shows the before and after of a job that without Dynatrace would have been impossible:
All data is from a test environment run by an end user to see actual reactions. No users were harmed during the film of this video![]()
- Mark as New
- Bookmark
- Follow
- Mute
- Subscribe to RSS Feed
- Permalink
24 Feb 2023 10:53 AM
LOVE the storytelling aspect of your use case @DanielS! 😍
- Mark as New
- Bookmark
- Follow
- Mute
- Subscribe to RSS Feed
- Permalink
24 Feb 2023 12:20 PM - edited 24 Feb 2023 12:21 PM
So many great use cases it's hard to pick a single one 🙂
The first time I used the ServiceFlow (back then TransactionFlow in AppMon ![]() actually) at a big customer with thousands of Java Agents stuck in my memory though. With most transactions hitting upwards of 70 services in a single call it was no wonder they had issues pinpointing performance problems without a tracing tool.
actually) at a big customer with thousands of Java Agents stuck in my memory though. With most transactions hitting upwards of 70 services in a single call it was no wonder they had issues pinpointing performance problems without a tracing tool.
With Dynatrace I love the continuous memory profiling. Makes analyzing so much faster, compared to taking a few dumps and comparing them.
- Mark as New
- Bookmark
- Follow
- Mute
- Subscribe to RSS Feed
- Permalink
25 Feb 2023 03:28 PM - edited 28 Feb 2023 01:13 PM
Hi there!
My use case is related to AIX & WebLogic 🙂
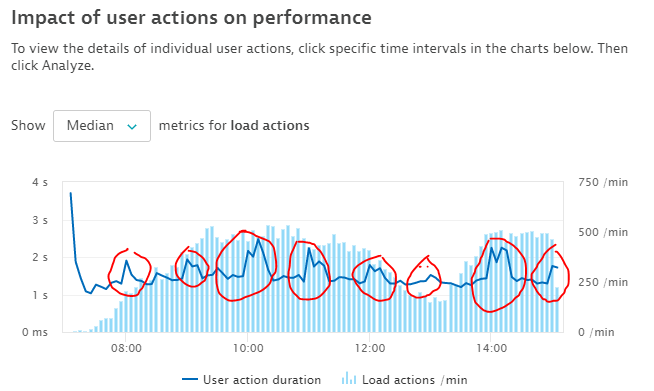
Some time ago, customer detected a recurring anomaly by observing the Browser response times and asked me to investigate the root cause:
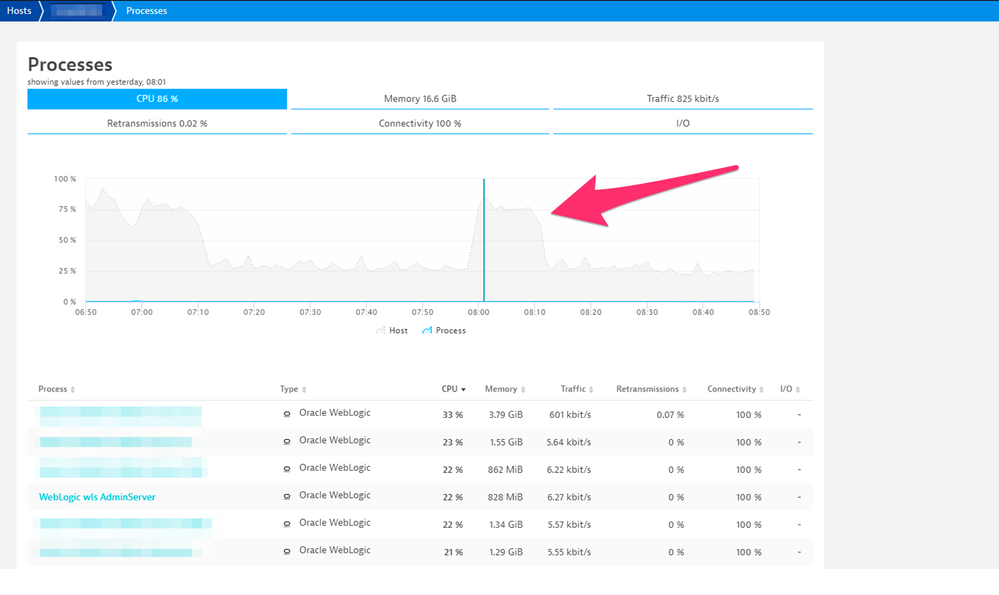
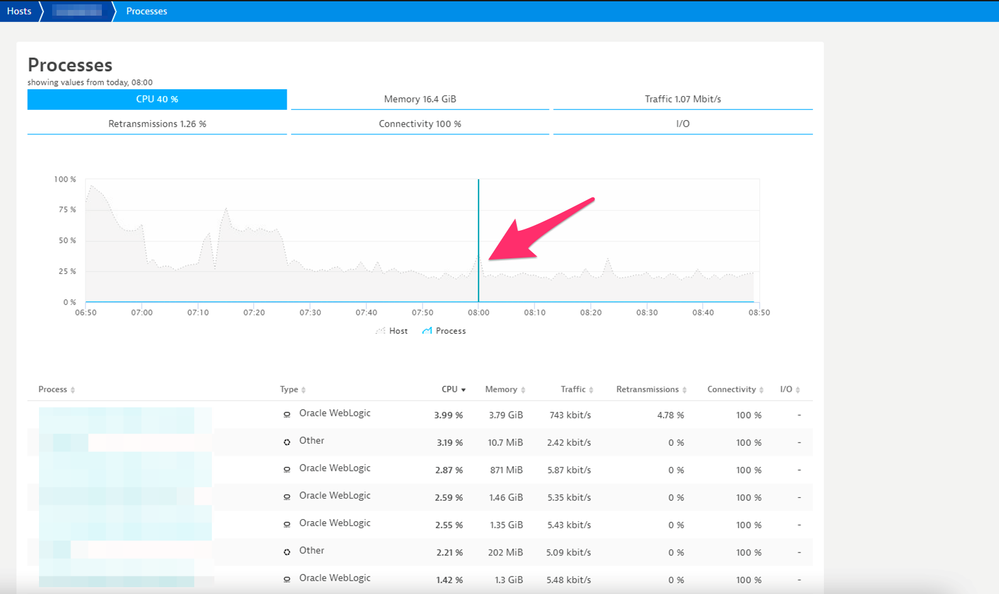
We identified a huge CPU spike every fixed hour:
10 minutes of recurrent full contention in production, no way. Let's deep dive in the CPU profiling :
Thanks to it we saw many locks related to the code cache and something goes wrong with an increased size every hour:
Long-term view confirmed the anomaly:
After some research we found this useful article : https://www.igorkromin.net/index.php/2017/09/25/how-to-fix-weblogic-high-cpu-usage-due-to-a-corrupte...
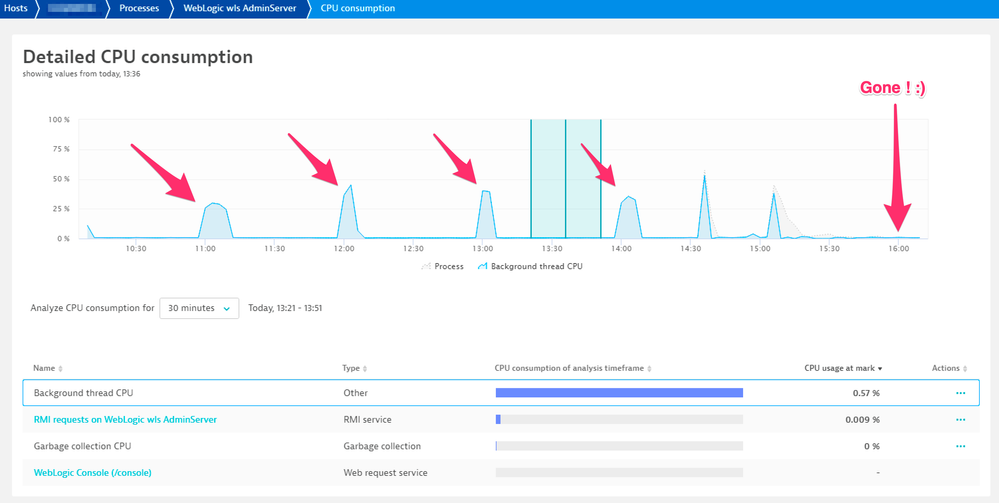
CPU Spike was reduced a lot after the clean of this DAT File:
Better but the Spike still remained. I found another awesome article, same author, same quick win:
So we disabled Diagnostic Archive (which was enabled by default on all WebLogic servers ..) ... annnnd ....
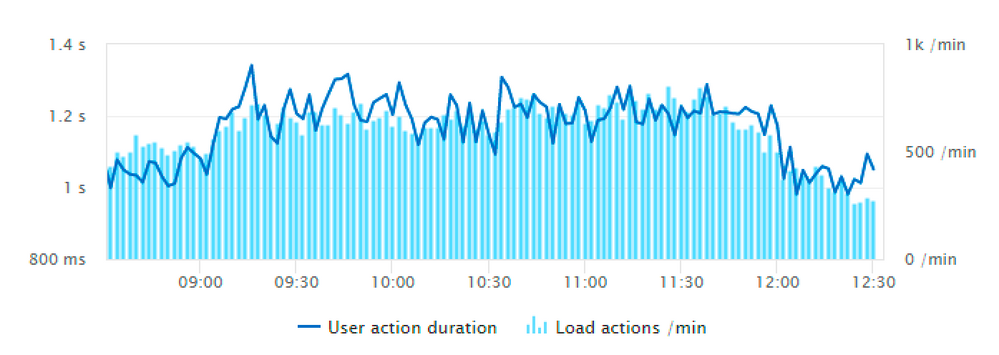
This resulted in an immediate gain in stability and overall user response time:
Thanks Dynatrace !
Julien
- Mark as New
- Bookmark
- Follow
- Mute
- Subscribe to RSS Feed
- Permalink
28 Feb 2023 11:54 AM
Thank you for sharing your amazing use case with the Community, Julien! 😊 And those useful links as well!
- Mark as New
- Bookmark
- Follow
- Mute
- Subscribe to RSS Feed
- Permalink
02 Mar 2023 01:14 PM
Love this one. Thanks for sharing.
- Mark as New
- Bookmark
- Follow
- Mute
- Subscribe to RSS Feed
- Permalink
01 Mar 2023 08:36 AM
Hello everyone,
this is a use case related to one of our customers in the banking sector while upgrading the core banking system, although it was tested on the UAT and results had been evaluated by Dynatrace with no issue, however, after upgrading the system on the production environment, there was a degradation in the performance that impacting multiple channels including the digital channel.
of course, multiple services problems had been generated on other impacted systems, and to be honest, it was a little bit difficult to get the exact root cause of the problem out-of-the-box especially since this was a new upgraded system that hosted on new servers and the automated baselining was still in the learning period. so by using the service flow, backtrace, and (purepath) distributed traces, we found that there were extensive calls to the database by the application which was something wrong with the code, also we've found slow response time on the database not only related to these calls but the response time degradation was on certain tables and as suspected these tables were not indexed.
- Mark as New
- Bookmark
- Follow
- Mute
- Subscribe to RSS Feed
- Permalink
01 Mar 2023 01:23 PM - edited 02 Mar 2023 12:37 PM
It was then that we decided to look into Azure Front Door metrics and log-gathering to build up a set of metrics with dimensions. Every request included such values as pop, cache.status, http.status, request.uri and so on. Ultimately, this process enabled us to certify that the caching on Azure Front Door had caused disparate responses for requests made for the same URLs: a cache HIT took just a few milliseconds to process, but a cache MISS or NO_CACHE consumed up to 30+ seconds. Exploration of factors such as origin, rules and routes further uncovered what was really happening..
All the mistakes and caching difficulties have now been almost wholly resolved or amelioration plans are underway. Consolidating all the components together here was instrumental in finding the underlying cause. When searching for elusive solutions, Dynatrace is a great tool as it provides the capacity to exclude certain components using various data readings.
We posted a blog on how to do this here.
- Mark as New
- Bookmark
- Follow
- Mute
- Subscribe to RSS Feed
- Permalink
02 Mar 2023 11:25 AM - edited 02 Mar 2023 11:26 AM
Hello members,
My turn to talk about an issue encountered during a load testing campain before the golive of a new plateform related to the checkout system of a retail client.
An inflection point was detected approximatively around 60 hits/sec (the production target was 115 hits/sec equivalent in business to 60K checkout /H) :
Due to a Cpu and memory contention on application servers (detected by Davis) :
The impact was huge on key transactions response time:
After analysis, the behaviour of suspension time before and after the inflection point was suspicious :
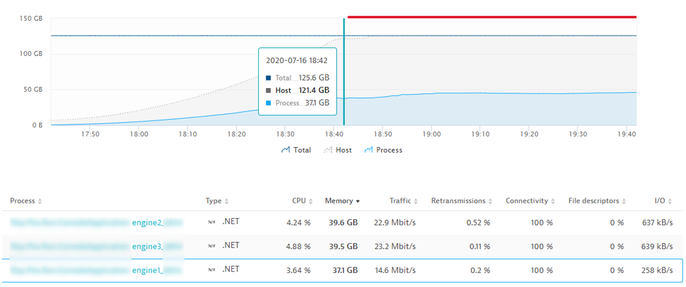
And a memory leak was suspected on .net because the memory allocation was never released even when the load testing was off :
To go further a heap dump memory was generated during the next similar test.
Developers use it to identify objects related to the memory leak and they identified an anomaly with objects which generate GC anormal behaviour when the amount of object created reach a certain volume in million.
Few days later, a workaround was implemented by developpers to solve the .Net memory leak.
Thanks to dynatrace, others optimizations on jvm, load balancing and api performance were done to reach the goals of this campain and give confidence for the platform production launch.
Regards Aurelien.
- Mark as New
- Bookmark
- Follow
- Mute
- Subscribe to RSS Feed
- Permalink
08 Mar 2023 09:46 PM
One Day, all frontends got unexplained slowdown from , we detected through anomaly detection for the user experience.. , through long journey of the analysis, we discovered a hint through one of the network metrics got increased suddenly, which is RTT for many uncorrected servers, finally, we discovered huge backup traffic exceeded the interface bandwidth of one of the firewall security devices..
- Mark as New
- Bookmark
- Follow
- Mute
- Subscribe to RSS Feed
- Permalink
10 Mar 2023 12:39 PM
Today is the last day to submit your answer to the Tracing Fan Challenge! ![]()
Make sure you've shared your story in the comments to be considered as one one of three laureates granted with gift codes to the Dynatrace Swag Store!
- Mark as New
- Bookmark
- Follow
- Mute
- Subscribe to RSS Feed
- Permalink
13 Mar 2023 01:01 PM
Hello, dear Community friends!
And welcome to the closing ceremony of our February Community challenge 🎉
We'd like to start by thanking all participants for their awesome use cases, that provided invaluable insights into how Tracing tools are being used. We didn't expect such detailed and even illustrated replies, but it was the best surprise we could have asked for 😉 And it was nice to see some new faces among the familiar ones, too!
@josef_schiessl and his team have carefully went through all use cases submitted for this Challenge and chose their three favorite ones. With no further ado, join us in congratulating the winners! 🤗
- @Mizső - not only analysing the issue but also using Dynatrace to verify the fix 💪
- @ChadTurner - reminding us that Smartscape is only there because of tracing and the topology that is created through it
- @jegron - using a multitude of tools to fix a problem that seems impossible to diagnose without a tool like Dynatrace

Thank you once again and see you in the comment section of our new Community challenge that is going to be published tomorrow 😉 Cheers!
- Mark as New
- Bookmark
- Follow
- Mute
- Subscribe to RSS Feed
- Permalink
13 Mar 2023 01:43 PM
![]()
![]()
![]()
![]()
![]()
![]()
![]()
![]()
![]()
![]()
![]()
![]()
![]()
![]()
![]()
![]()
![]()
![]()
![]()
![]()
![]()
- Mark as New
- Bookmark
- Follow
- Mute
- Subscribe to RSS Feed
- Permalink
14 Mar 2023 07:54 AM
Thank you very much everyone for participating! It was very interesting to read all the replys and the different usecases we help you solve. Hopefully our future advancements in our tools can help you out even more!
Cheers,
Josef
- Mark as New
- Bookmark
- Follow
- Mute
- Subscribe to RSS Feed
- Permalink
19 Mar 2023 12:29 PM
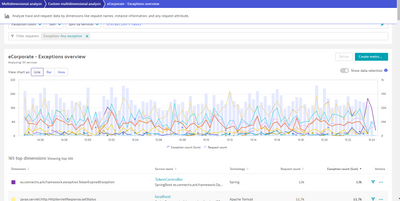
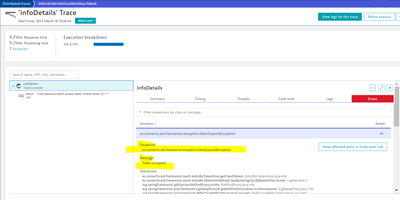
For me one of the most important thing is that we are using the traces to reduce the failure rates by ignoring some business Failures.
For each application, We are exporting all faced exceptions, share with developers and business team to state what is Business error and What is not.
So after removing all business Exceptions and keep only Technical ones, the failure rate statistics start to be more accurate (before the rate was very High and not reflect the real Application Availability).
Featured Posts
