- Dynatrace Community
- Ask
- Container platforms
- Kubernetes/OpenShift CPU Throttling - What is the best metric?
- Subscribe to RSS Feed
- Mark Topic as New
- Mark Topic as Read
- Pin this Topic for Current User
- Printer Friendly Page
- Mark as New
- Subscribe to RSS Feed
- Permalink
18 Sep 2023
07:53 PM
- last edited on
19 Sep 2023
08:46 AM
by
![]() MaciejNeumann
MaciejNeumann
I am starting to grab more container-level statistics within Kubernetes/OpenShift. Someone mentioned to me about the importance of measuring CPU throttling. What is the best metric in DT for measuring CPU throttling?
I am already grabbing container CPU, millicores, millicores and maximum. Is there an actual statistic for the percentage or degree of throttling?
Any help would be appreciated.
Thanks,
Lou
Solved! Go to Solution.
- Labels:
-
kubernetes
-
openshift
- Mark as New
- Subscribe to RSS Feed
- Permalink
18 Sep 2023 08:28 PM
Yes exist, the metric is literally CPU throttling haha
"The CPU throttling metric tells you how long the application was throttled, so you can determine where more CPU time would have been needed for processing. This usually happens when the containers don't have enough CPU resources (limits) in the workload definition. This might affect the performance of the processes and applications running inside the containers."
Take a look on this documentation page
You can also see the number of running pods versus desired pods for every cloud application.
- Mark as New
- Subscribe to RSS Feed
- Permalink
19 Sep 2023 10:39 PM - edited 19 Sep 2023 10:42 PM
Hi @crabbylou,
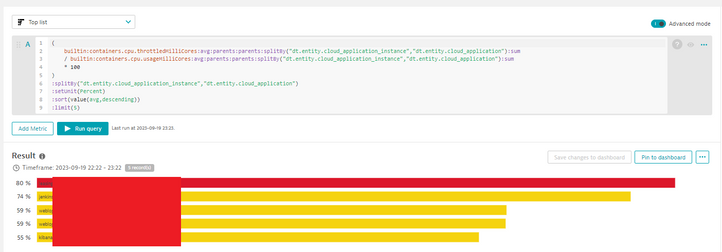
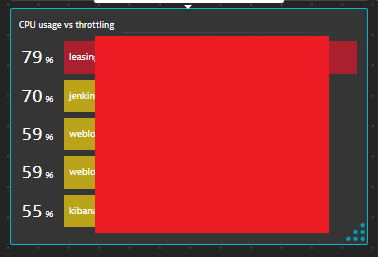
I usually use these ones at clinets:
( builtin:containers.cpu.throttledMilliCores:avg:parents:parents:splitBy("dt.entity.cloud_application_instance","dt.entity.cloud_application"):sum
/ builtin:containers.cpu.usageMilliCores:avg:parents:parents:splitBy("dt.entity.cloud_application_instance","dt.entity.cloud_application"):sum
* 100
)
:splitBy("dt.entity.cloud_application_instance","dt.entity.cloud_application")
:setUnit(Percent)
:sort(value(avg,descending))
:limit(5)
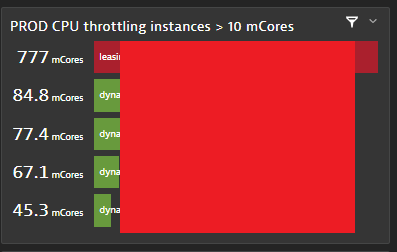
or
builtin:containers.cpu.throttledMilliCores
:filter(series(avg,gt,10))
:parents:parents:splitBy("dt.entity.cloud_application_instance","dt.entity.cloud_application")
:avg
:auto
:sort(value(avg,descending))
:limit(5)
I hope it helps.
Best regards,
Mizső
Featured Posts


