- Dynatrace Community
- Ask
- Container platforms
- Re: Kubernettes Resource Alerts on Nodes but not Pods?
- Subscribe to RSS Feed
- Mark Topic as New
- Mark Topic as Read
- Pin this Topic for Current User
- Printer Friendly Page
- Mark as New
- Subscribe to RSS Feed
- Permalink
13 Feb 2023 04:57 PM
I keep seeing these CPU & Memory saturation alerts on Kubernettes hosts/nodes complaining about CPU being maxed out at 100%. But when I go into the problem in Dynatrace, I see that the node/host actually has 13% CPU usage. The same thing occurs on memory saturation alerts.
So, these are either false alerts or these problem alerts are actually complaining about CPU/memory saturation on individual pods, but there are many pods on each node. Is there a way to get Dynatrace to be more specific about what specific entity is having an issue?
Solved! Go to Solution.
- Labels:
-
aws
-
kubernetes
-
problems classic
- Mark as New
- Subscribe to RSS Feed
- Permalink
14 Feb 2023 01:45 PM
Hi @shakib,
Can you provide an example from your env?
Thanks in advance.
Best regards,
Mizső
- Mark as New
- Subscribe to RSS Feed
- Permalink
15 Feb 2023 04:04 PM
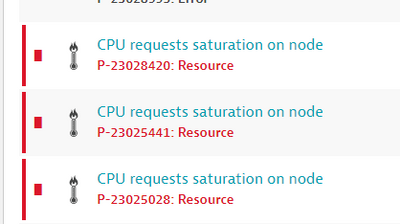
So I see these problems:
The problem will advise of CPU request saturation at 94% on the node.
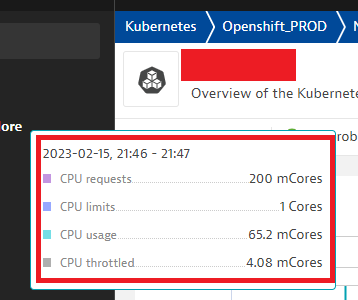
When I go into this node, regular CPU usage is normal but the CPU request saturation is really high. I want to know what pods or containers are contributing to this request saturation and I don't see such level of detail on the host/node page.
- Mark as New
- Subscribe to RSS Feed
- Permalink
15 Feb 2023 09:29 PM - edited 15 Feb 2023 09:32 PM
Hi @shakib,
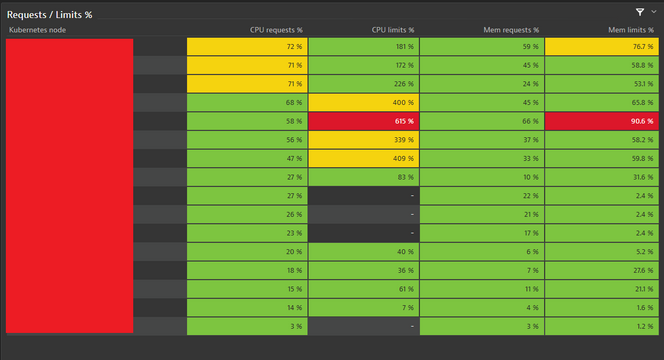
CPU request can be higher than the real CPU usage. CPU request the minimum CPU resource at the pod start. In your alert the SUM CPU resource quota reached the allocable CPU 94% on that node. Eg. you have 100 core allocable CPU in your node, and the pods on this host requested SUM 94 core. It does not mean that they will use it.
I think your problem is a configuration issue, your node a little bit overbooked regarding CPU requests. Maybe there are an autoscaling mechanism in place for load an some extra pods started.
Here is an example for a small cluster dashboard part at node level (requests and limits based on the allocable resources):
You can use these metrics to check the cpu requests on namespace level. Which namespace are the top "consumer" of the cpu requests. There is an embedded default dashboard by Dynatrace Kubernetes namespace resource quotas.
| builtin:kubernetes.resourcequota.requests_cpu | Kubernetes: Resource quota - CPU requests This metric measures the cpu requests quota. The most detailed level of aggregation is resource quota. The value corresponds to the cpu requests of a resource quota. | Millicores | autoavgmaxmin |
| builtin:kubernetes.resourcequota.requests_cpu_used | Kubernetes: Resource quota - CPU requests used This metric measures the used cpu requests quota. The most detailed level of aggregation is resource quota. The value corresponds to the used cpu requests of a resource quota. | Millicores | autoavgmaxmin |
I hope it helps.
Best regards,
Mizső
- Mark as New
- Subscribe to RSS Feed
- Permalink
16 Feb 2023 06:29 PM
Thank you, Mizső!
So I have a takeaway to see if I can find out more about the CPU limits on the Nodes.
I did try to create something using these 2 metrics but sadly for my environment there are no data at all (which is surprising because these are a namespace entity and dimension and I have namespaces set up).
| builtin:kubernetes.resourcequota.requests_cpu |
|
| builtin:kubernetes.resourcequota.requests_cpu_used |
- Mark as New
- Subscribe to RSS Feed
- Permalink
08 Apr 2024 12:04 AM
I am observing the same issue. CPU reserve / CPU allocated ratio is over 90%. CPU usage is 5%.
I understand that sum of CPU reserve for each pod high and it should be adjusted.
Do we need to worry about this ratio as long as CPU usage is not high?
- Mark as New
- Subscribe to RSS Feed
- Permalink
08 Apr 2024 08:26 AM
A high ratio (over 90%) indicates that a significant portion of CPU resources is reserved but not actively utilized by pods, while this might not be a problem if the overall CPU usage is low, it can lead to inefficiencies and resource wastage. You mentioned that the CPU usage is currently at 5%. As long as the usage remains low, the high reserve-to-allocated ratio may not immediately impact performance.
High reserve-to-allocated ratios can cause resource contention, especially when other pods require additional CPU resources.
https://kubernetes.io/docs/tasks/administer-cluster/reserve-compute-resources/
Featured Posts


