- Dynatrace Community
- Ask
- DQL
- Re: Can't use graph in new UI Dashboard
- Subscribe to RSS Feed
- Mark Topic as New
- Mark Topic as Read
- Pin this Topic for Current User
- Printer Friendly Page
- Mark as New
- Subscribe to RSS Feed
- Permalink
09 Nov 2023 03:44 PM - edited 09 Nov 2023 04:17 PM
So I have a query to take the last value seen per day for a field monthly requests, this filed is a running total per hour of requests and as the name suggests gets reset every month.
fetch bizevents , scanLimitGBytes: 100
| filter event.type == "XXXXXXX"
| summarize {monthlyRequests = takeLast(monthlyRequests)},by:{bin(timestamp, 1d)}
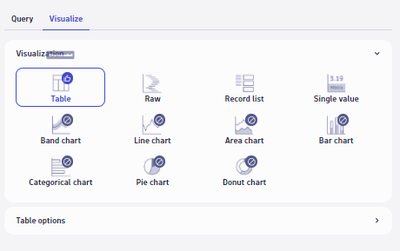
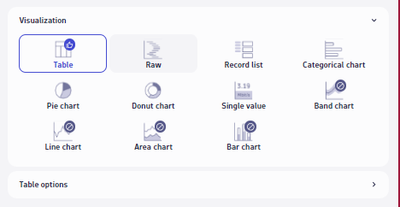
I want to graph this on the new UI but the visualization options do not show for any graph
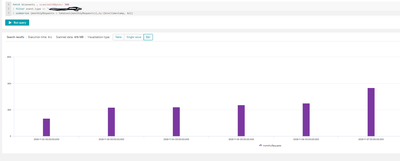
However exactly the same query in the logs and events explorer does allow bar charting
Any ideas why the new UI is not allowing charting using this Grail query?
Also if someone can advise how to get the date to be just the date and not add the 00:00:00 for aesthetic reasons that would be great
EDIT, I fixed the displayed timestamp using this line of DQL instead
| summarize {monthlyRequests = takeLast(monthlyRequests)},by:{Date = formatTimestamp(bin(timestamp, 1d),format:"dd-MM-YYYY")}Solved! Go to Solution.
- Mark as New
- Subscribe to RSS Feed
- Permalink
09 Nov 2023 04:07 PM
Also is there a way to do a bin(value, 1M)
It appears that DQL does not match the older intervals in the product and stops at 1d
Time literals
The following time literals can be used to express durations:
ns: Nanoseconds
ms: Milliseconds
s: Seconds
m: Minutes
h: hours
d: Days
- Mark as New
- Subscribe to RSS Feed
- Permalink
09 Nov 2023 05:57 PM - edited 09 Nov 2023 06:03 PM
After some playing I've found half the root cause of the issue.
On ingestion of the BizEvent the field monthlyRequests is actually seen a string field and to make the new UI use it as a number I had to add the toLong() to the query.
| summarize {`Monthly Requests` = toLong(takeLast(monthlyRequests))},by:{Date = formatTimestamp(bin(timestamp, 1d),format:"MM-dd-YYYY")}
It seems the log and events app does this without having to use the toLong() to convert it to a number so there is an inconsistency between the apps on the platform.
However some charts have appeared but not the required line/bar charts
Featured Posts


