- Dynatrace Community
- Ask
- DQL
- Re: Dashboard Grails query vs Notebook Grails query - different results
- Subscribe to RSS Feed
- Mark Topic as New
- Mark Topic as Read
- Pin this Topic for Current User
- Printer Friendly Page
- Mark as New
- Subscribe to RSS Feed
- Permalink
16 Aug 2023
06:37 PM
- last edited on
17 Aug 2023
07:55 AM
by
![]() MaciejNeumann
MaciejNeumann
I have been developing the following query in a Notebook which seems to provide me accurate results
fetch logs, from: bin(now()-6d, 1d) + 23h + 0m, to: now()
| filter matchesValue(aws.log_group, "Prod-mop-service-order-int") and matchesPhrase(content, "HTTP_INBOUND") and matchesPhrase(content, "/api/mopServiceOrder") and matchesPhrase(content, "ABC LTD")
| fieldsAdd Date= formatTimestamp(timestamp,format:"dd/MM/YYYY")
| summarize Count = count(), by:{Date}
| sort Date desc
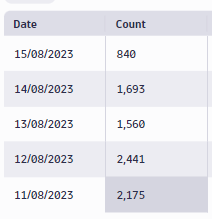
this provides the following correct output
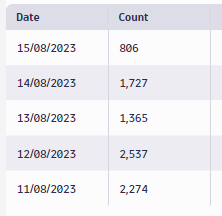
However when I drop the same query onto a Dashboard as a Grails query I get the following result set which is incorrect
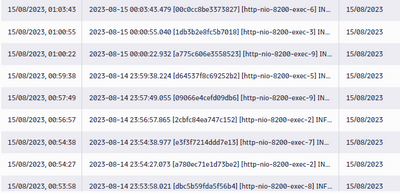
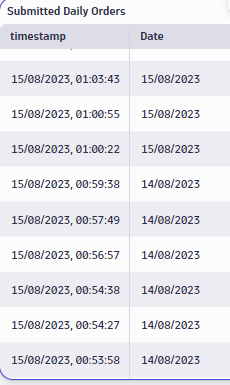
The problem seems to be that formatTimestamp(timestamp,format:"dd/MM/YYYY") seems to be working correctly in Notebook but not on a Dashboard. The issue seems to be with events with a timestamp up to 1hr after the midnight boundary getting allocated to the previous day.
Notebook
Dashboard
This would seem to attribute to difference between 806 and 840
Any ideas how this would be functioning differently on a dashboard?
Solved! Go to Solution.
- Mark as New
- Subscribe to RSS Feed
- Permalink
17 Aug 2023 09:21 AM
Hi @garryclarke, and thanks for your post. It looks like it's not something you can tweak on the dashboard itself, but rather a bug. It's reported and our engineers will look into it.
Featured Posts


