- Dynatrace Community
- Ask
- DQL
- Re: Extracting details from lookup DQL
- Subscribe to RSS Feed
- Mark Topic as New
- Mark Topic as Read
- Pin this Topic for Current User
- Printer Friendly Page
- Mark as New
- Subscribe to RSS Feed
- Permalink
13 Apr 2023
02:28 PM
- last edited on
30 May 2023
11:17 AM
by
![]() MaciejNeumann
MaciejNeumann
Hi,
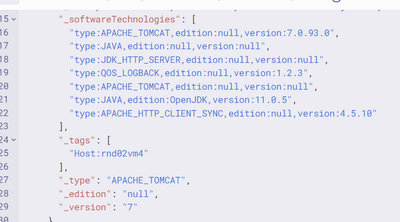
I wanted to extract the type, edition and versions out from the technologies to be different columns in a table as well as do a bar chart specifically for type.
"monitoringMode": "FULL_STACK",
"lookup.entityId": "PROCESS_GROUP_INSTANCE-61A60B5D26F3BB1B",
"lookup.entityName": "com.dynatrace.easytravel.weblauncher.jar easytravel-*-x*",
"lookup.softwareTechnologies": [
"type:QOS_LOGBACK,edition:null,version:1.2.3",
"type:APACHE_TOMCAT,edition:null,version:7.0.93.0",
"type:JAVA,edition:OpenJDK,version:11.0.5",
"type:JDK_HTTP_SERVER,edition:null,version:null",
"type:APACHE_TOMCAT,edition:null,version:null",
"type:JAVA,edition:null,version:null",
"type:APACHE_HTTP_CLIENT_SYNC,edition:null,version:4.5.10"
],
Secondly, is there any way for me to change the name lookup.softwareTechnologies to just softwareTechnologies. As I couldn't access it with the "."
monitoringMode: record.values?.monitoringMode as string,
softwareTechnologies: record.values?.softwareTechnologies,

Failed with :
softwareTechnologies: record.values?.lookup.softwareTechnologies,
DQL:
fetch dt.entity.host, timeframe:"2023-03-01T00:00:00Z/2023-04-05T12:00:00Z"
|fieldsAdd osVersion, cpuCores, memory = (memoryTotal/1000/1000000), ipAddress, monitoringMode
|lookup [fetch dt.entity.process_group_instance
|fieldsAdd softwareTechnologies, tags |filterOut contains (entityName, "OneAgent") OR contains (entityName, "Linux") OR contains (entityName, "sshd") OR contains (entityName, "Short-live") OR contains (entityName, "master") ], sourceField:tags, lookupField:tags
Solved! Go to Solution.
- Labels:
-
apps
-
dql
-
latest dynatrace
- Mark as New
- Subscribe to RSS Feed
- Permalink
13 Apr 2023 03:29 PM
Hi @kwangxi, you can extract type, edition, and version using the parse command. Something like this should work:
| filterOut ...
| parse softwareTechnologies[0], "'type:' WORD:type ',edition:' WORD:edition ',version:' WORD:version"
As for the second question, there's no way to remove the prefix completely, but you can change it with the prefix argument like this:
lookup [
  ...
], sourceField:tags, lookupField:tags, prefix:"_"
Now you can access the values like this:
record.values._softwareTechnologies
record.values._types
...
But I'm still curious why the access via lookup fails. Would you try this instead?
record.values["lookup.softwareTechnologies"]
- Mark as New
- Subscribe to RSS Feed
- Permalink
13 Apr 2023 03:53 PM
Hi,
Thanks for the prefix, it would definitely be the solution for it.
Btw for this, it would only get the 1st array which is [0], is there any way to populate in for the rest of the arrays too?
| filterOut ...
| parse softwareTechnologies[0], "'type:' WORD:type ',edition:' WORD:edition ',version:' WORD:version"
- Mark as New
- Subscribe to RSS Feed
- Permalink
13 Apr 2023 04:45 PM
You're right! My bad. What you need is a bit more complex and I'm not sure the format you need it in, here's what I came up with:
| filterOut ...
| fieldsAdd technologiesString = toString(softwareTechnologies)
| parse technologiesString, "'[' ARRAY{'type:' WORD*:type (',edition:' LD ',version:' LD (', ' | ']'))}{1,}:types"
| parse technologiesString, "'[' ARRAY{'type:' LD ',edition:' WORD*:edition (',version:' LD (', ' | ']'))}{1,}:editions"
| parse technologiesString, "'[' ARRAY{'type:' LD ',edition:' LD ',version:' LD*:version (', ' | ']')}{1,}:versions"
This way, you'll have 3 arrays containing the types, editions, and versions. Additionally, if you need to remove the duplicates, you can use:
| fieldsAdd types = arrayDistinct(types), editions = arrayDistinct(editions), versions = arrayDistinct(versions)Hope it works as expected this time.
- Mark as New
- Subscribe to RSS Feed
- Permalink
13 Apr 2023 06:03 PM
Hi,
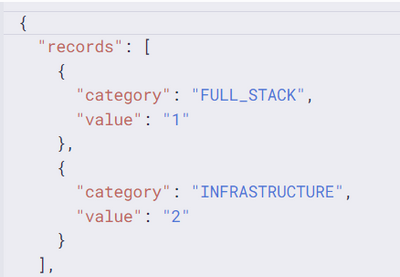
Previously, I was summarizing the monitoring mode to be in this way, so it can be captured and read by the DT chart.
I intend to achieve the software technologies in this way, may I ask is there any way to achieve this?
Let's say, for all 3 hosts, I found there are 3 Java so it would be:
{
"category": "JAVA",
"value": "3"
},
{
"category": "APACHE_TOMCAT",
"value": "1"
},
.....
- Mark as New
- Subscribe to RSS Feed
- Permalink
17 Apr 2023 01:13 PM
Unfortunately, I don't see how to achieve what you want in DQL. There's a big difference with the monitoring mode, and is that the monitoring mode is only one value per host, while the technologies are an array. I recommend doing a simple DQL query to get the raw data and parse and aggregate the technologies in code. Let me know if I can help with anything else.
- Mark as New
- Subscribe to RSS Feed
- Permalink
30 Oct 2023 03:27 PM
This is indeed tough since the data is so deeply nested. While stating that, on the product side we can represent the software technologies data in an easier to use way, at least we can extract the data with DQL.
fetch dt.entity.process_group_instance
| fieldsadd softwareTechnologies
| expand softwareTechnologies
| parse softwareTechnologies, "kvp{[a-z]*:key ':' LD:value (EOS|',')}:techs"
| fieldsflatten techs
What should also be stated that this is in many cases not necessary as we enrich that information e.g. on logs
So you can directly group your data by technology:
fetch logs
| fields timestamp, process.technology
| expand process.technology
Featured Posts


