- Dynatrace Community
- Ask
- DQL
- Re: Timeseries DQL Query returns no results when fields value is entity.name, but works when it is id
- Subscribe to RSS Feed
- Mark Topic as New
- Mark Topic as Read
- Pin this Topic for Current User
- Printer Friendly Page
- Mark as New
- Subscribe to RSS Feed
- Permalink
06 Oct 2023
05:48 PM
- last edited on
08 Oct 2023
01:35 PM
by
![]() MaciejNeumann
MaciejNeumann
So yeah, very simple query that I pretty much copied from the Grail Examples in the Dynatrace documentation:
timeseries usage=avg(dt.host.cpu.usage),
    by:{dt.entity.host},
    filter:{
      dt.entity.host in [
       fetch dt.entity.host
      | fieldsAdd hostGroupName
      | filter hostGroupName == "HOST_GROUP_A"
      | fields id
       ]
    }
That returns back the two hosts in that host group along with their entityId as the names. However, if I change the
| fields id
line to
| fields entity.name
I get no results...
I changed nothing else other than that line. Why in the world can I not get the name of the hosts instead?
If I do a simple query like this:
fetch dt.entity.host
| filter hostGroupName == "HOST_GROUP_A"
I get back the two hosts in that group and it shows that each host has two fields, entity.name and id. So why can't I use entity.name in the fields line?
I even tried doing a fieldsAdd entity.name and that doesn't work either. I tried putting the fieldsAdd both inside of and outside of the filter block, but nothing works. I get no results if I don't use id. But who wants to have id on the charts? Nobody will know which host is which...
Solved! Go to Solution.
- Mark as New
- Subscribe to RSS Feed
- Permalink
06 Oct 2023 08:14 PM
Uggh, figured it out... For anyone that stumbles across this, it's really weird.
Apparently there are two ways of filtering timeseries data in DQL:
in and lookup.
in has better performance, but you're restricted to use whatever fields are part of the timeseries command output, which are just the metric, the timestamps, and the entityID of whatever you're querying. No name data or anything like that (which honestly makes it kind of useless... Who wants to display metric data with Entity ID's? People want readable names...)
lookup doesn't perform as well, but, you can add in any fields you want to be fed to the output, so you aren't stuck with just the entity id.
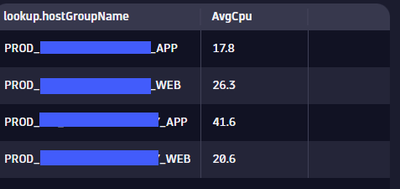
This is what I ended up with (this query returns the average CPU of all hosts in a specific management zone, grouped by the host groups):
timeseries usage=avg(dt.host.cpu.usage), by:{dt.entity.host}
| lookup [fetch dt.entity.host
| fieldsAdd hostGroupName, managementZones],lookupField:id , sourceField:dt.entity.host
| filter matchesValue(lookup.managementZones ,"Zone 1")
| summarize AvgCpu = avg(arrayMax(usage)), by:{lookup.hostGroupName}
Now I just need to add some time filters to the query and figure out how to get it to work in an API call and I can finally be done with what should have been an incredibly simple task...
Featured Posts

