- Dynatrace Community
- Ask
- Dashboarding
- Re: Average & Percentile Show the Same Value for Usage Metrics? Why?
- Subscribe to RSS Feed
- Mark Topic as New
- Mark Topic as Read
- Pin this Topic for Current User
- Printer Friendly Page
- Mark as New
- Subscribe to RSS Feed
- Permalink
23 Aug 2023
05:47 PM
- last edited on
24 Aug 2023
08:16 AM
by
![]() MaciejNeumann
MaciejNeumann
Hello -
I am charting CPU usage for containers, and I was hoping to display average utilization in conjunction with percentile utilization metrics on the same dashboard.
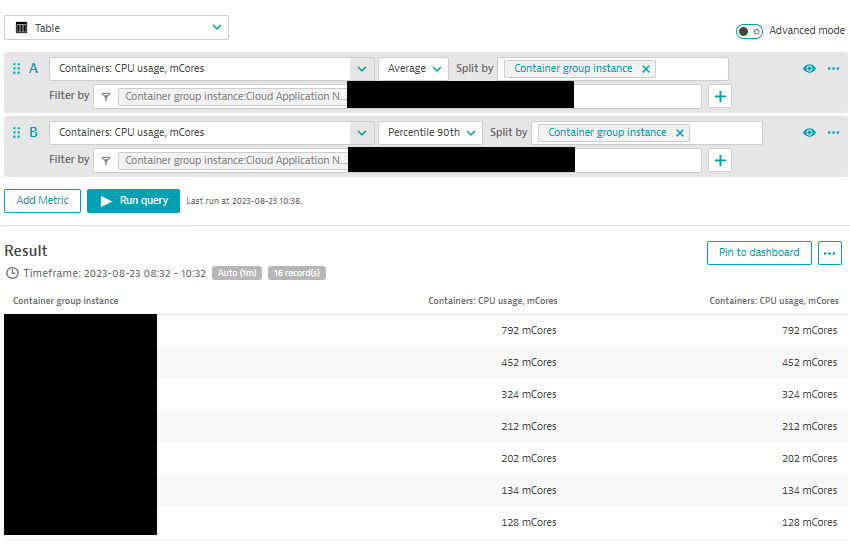
However I noticed that when I select a percentile value for aggregation, Dynatrace simply shows the me the average value twice (see screenshot). Why is this the case? Does Dynatrace not calculate percentiles for system usage metrics?
Thanks much,
Joel B
Solved! Go to Solution.
- Labels:
-
data explorer
-
metrics
- Mark as New
- Subscribe to RSS Feed
- Permalink
23 Aug 2023 06:25 PM - edited 23 Aug 2023 06:26 PM
Hi @j_butzow . Not all metrics are capable of aggregate as percentile.
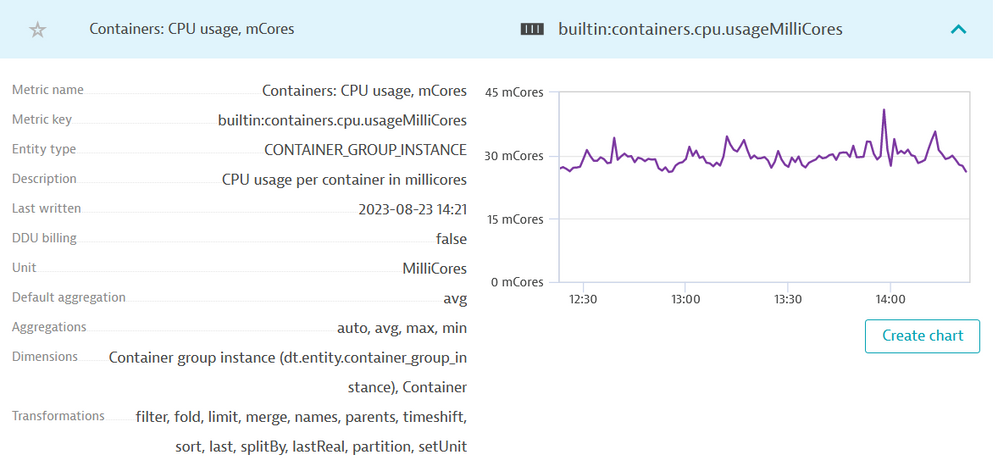
This one you are currently using, the builtin:containers.cpu.usageMilliCores, can be aggregated as auto, avg, max, min only.
You can check the aggregation possibilities in the metric page:
You can also find metrics that accept the percentile aggregation in the docs, https://www.dynatrace.com/support/help/observe-and-explore/metrics/built-in-metrics
Featured Posts


