- Dynatrace Community
- Ask
- Dashboarding
- Bug for key-request count on dashboard
- Subscribe to RSS Feed
- Mark Topic as New
- Mark Topic as Read
- Pin this Topic for Current User
- Printer Friendly Page
- Mark as New
- Subscribe to RSS Feed
- Permalink
29 Jun 2020 09:25 PM
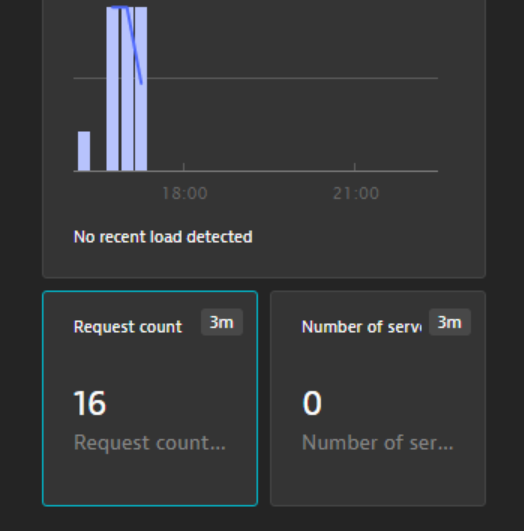
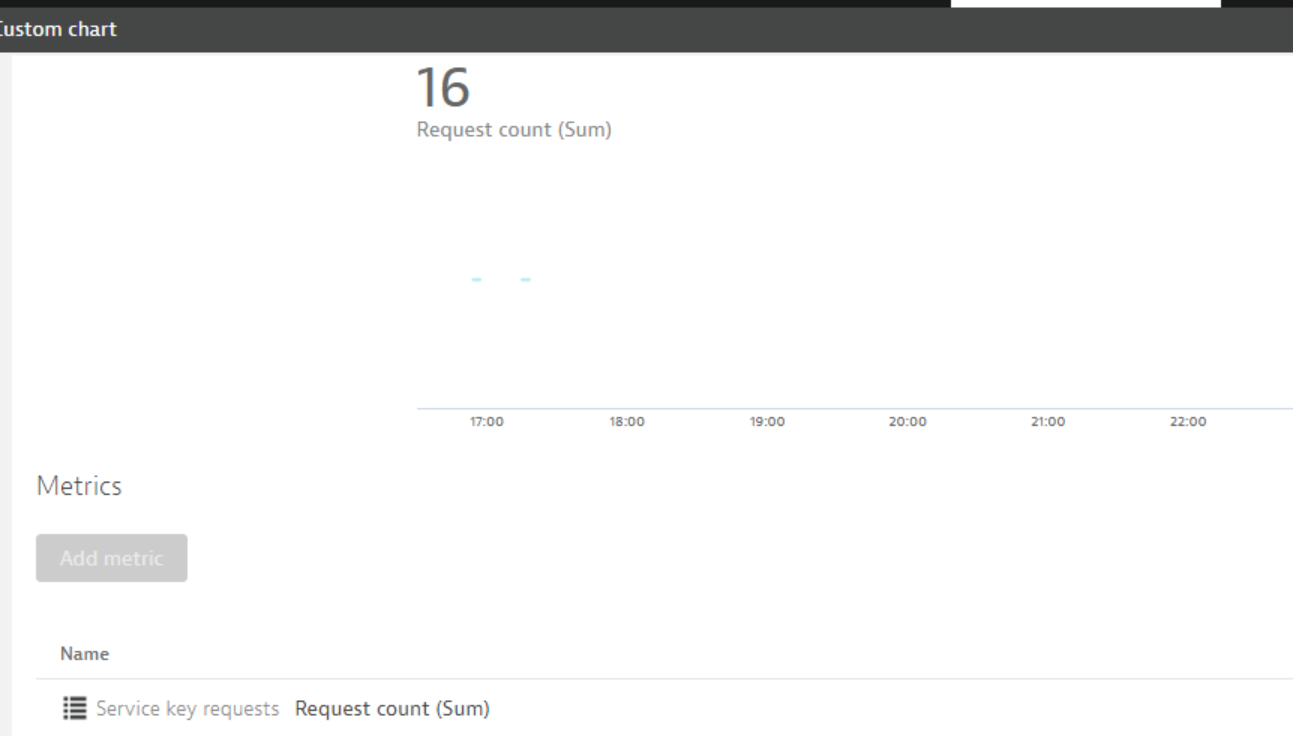
I added a metric count of key requests to dashboard.

we see on the dashboard an amount equal to 16
metric -> Request Count of Key-request

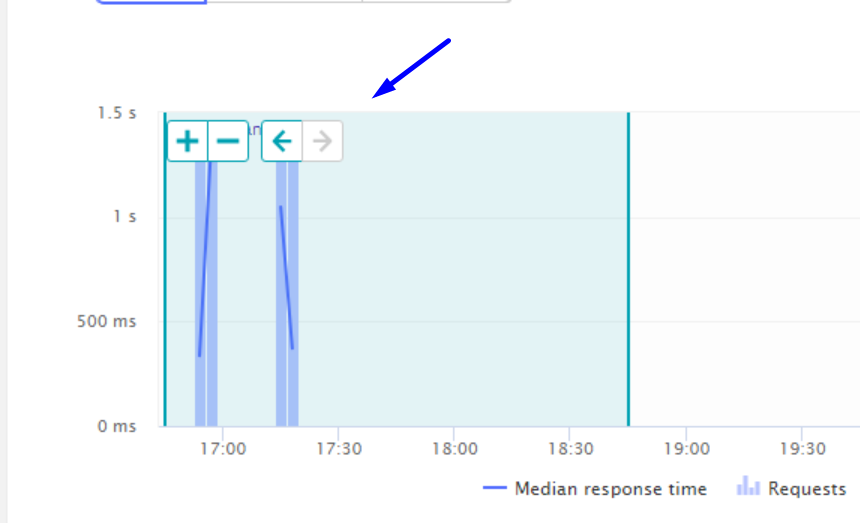
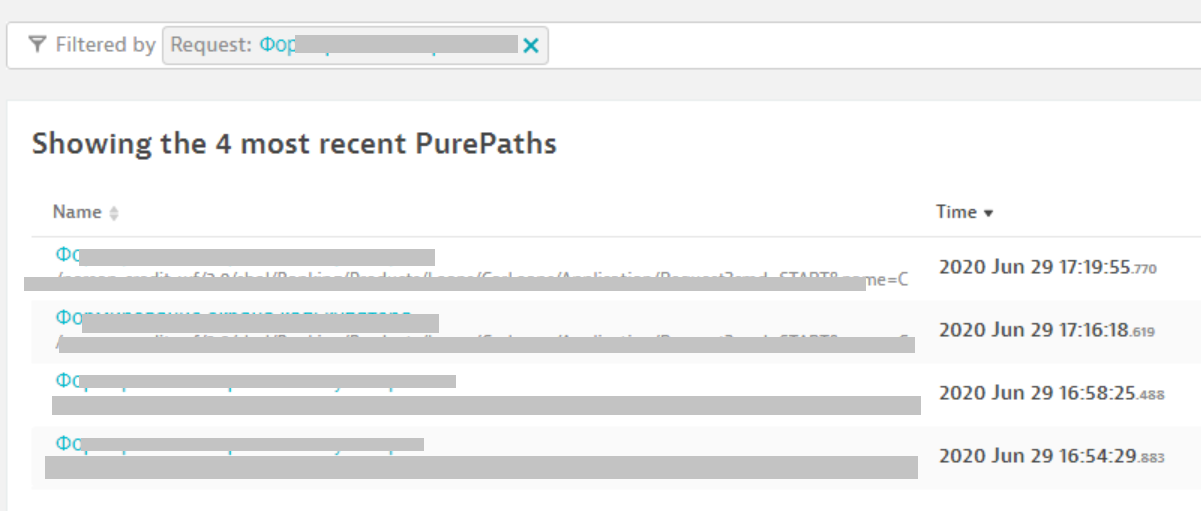
but when I go drill-down into key-request diagnostics, I see a different amount

it is only 4 purepath

Is it bug ?
Solved! Go to Solution.
- Mark as New
- Subscribe to RSS Feed
- Permalink
30 Jun 2020 02:06 AM
Hey Mikhali,
The number of PPs will almost always be less than the number of actual requests as Dynatrace samples the data on the PP level and groups PPs together if they are very similar to each other in their performance. If you hover over one of the PPs you will be able to see phrases like "5 other PPs like this one".
I hope this helps!
Thanks,
MG
- Mark as New
- Subscribe to RSS Feed
- Permalink
30 Jun 2020 09:02 AM
Hello , Thank you for answer.
Could you please send a link to the documentation where it is described.
I was told that dynatrace captures every operation without aggregation and sampling.
And if I capture different request attributes (for example, transaction id), then it turns out I can’t see them?
- Mark as New
- Subscribe to RSS Feed
- Permalink
30 Jun 2020 01:51 PM
This happens typically for Adaptive Traffic Management. If your process group instance is called more often than the limit (1000 request/minute), some requests are not captured and you get "x other purepaths like this".
See more details here:
https://www.dynatrace.com/support/help/how-to-use-dynatrace/transactions-and-services/monitoring/ada...
In Managed, you can increase the limit, but it may result into increased overhead. In SaaS you cannot get captured more than 1000 PP/minute from a process group instance.
Featured Posts
