- Dynatrace Community
- Ask
- Dashboarding
- Custom Dashboard Creation in Dynatrace
- Subscribe to RSS Feed
- Mark Topic as New
- Mark Topic as Read
- Pin this Topic for Current User
- Printer Friendly Page
- Mark as New
- Subscribe to RSS Feed
- Permalink
26 Nov 2020 11:31 AM
Hi, I have a web application MyApp which uses Middleware and consume multiple web services like GetCustomerDetails, GetBillingDetails etc. There are actually more than 30 web services.
We are using managed Dynatrace and it's been installed on both MyApp and Middleware hosts. Is there a way to plot a graph or create a single page dashboard to show the status of those web services?
For example a dashboard to show -
- Number of requests/traffic
- Any error occurred in past few days
- Success/Failure rate
- And few others.
Dynatrace has an option to create dashboard and pull the stats into chart but If i have 50 services that dashboard will get messy.
IS there a way to create a topology like smartscape topology to show everything at one place so that we can share that with stakeholders to see how the services/api's are behaving?
Solved! Go to Solution.
- Labels:
-
dashboards classic
-
services classic
- Mark as New
- Subscribe to RSS Feed
- Permalink
26 Nov 2020 07:42 PM
Hi @Shashank A.,
You might want to look into tagging of your services according to your requirements, e.g. add tags for the different service layers, or responsibility or type of service and then use these tags for filtering the various out of the box tiles on a dashboard.
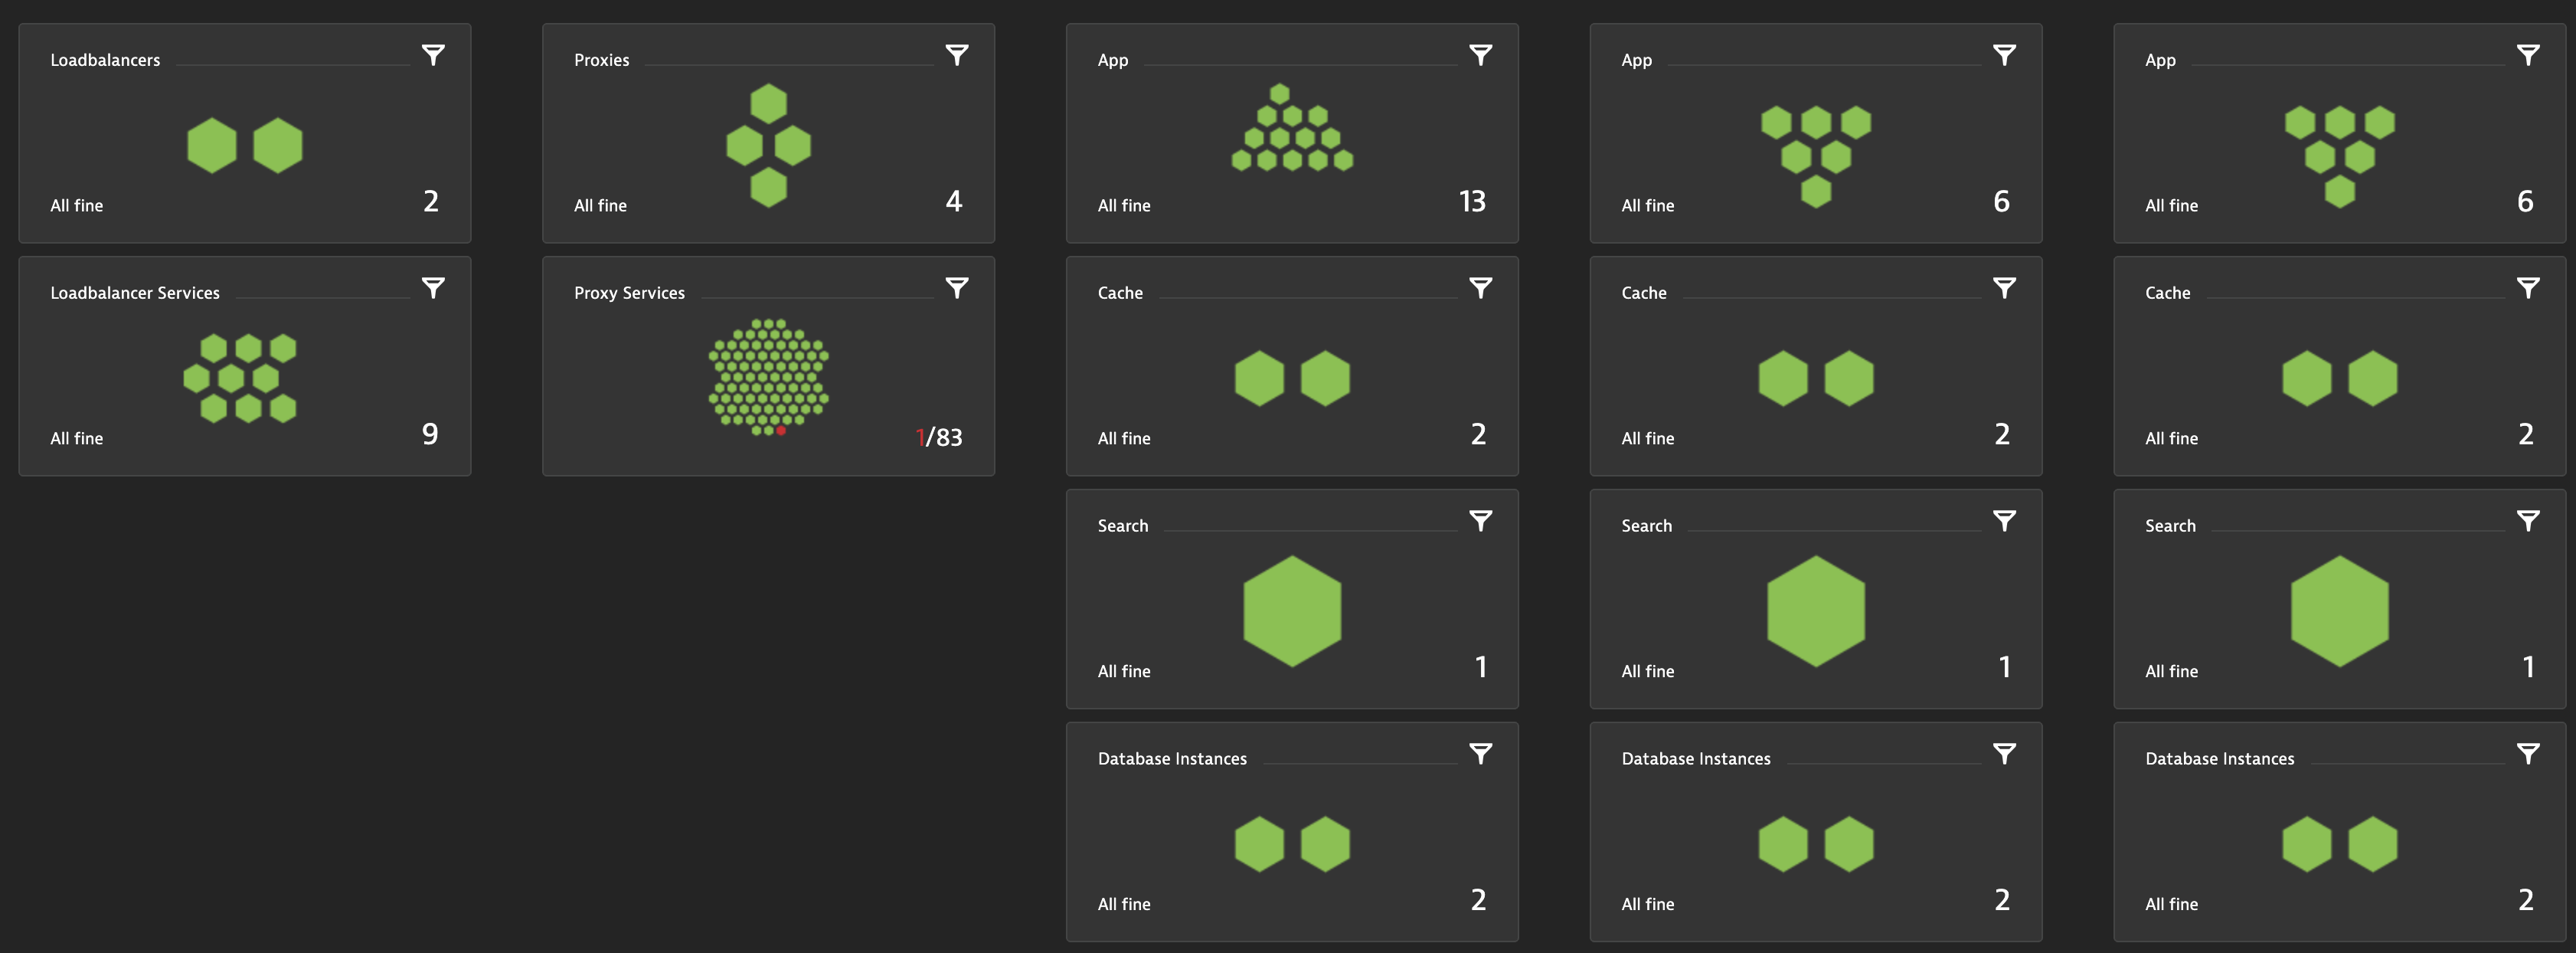
For example, here I have applied autotags to various services and only show the service tile for such tagged services:
What is not very obvious is that many out of the box tiles do not have tag filters but only managmentzone filters. My workaround for that is to tag entities and based on the tag add them to management zones and then filter the tile on the managementzone.
You can use the same approach for custom charts as well, but before placing charts (with lines etc) all over your dashboard you might also want to create a high level dashboard like the one above and use links (e.g. from the markdown tile) to other more detailed dashboards.
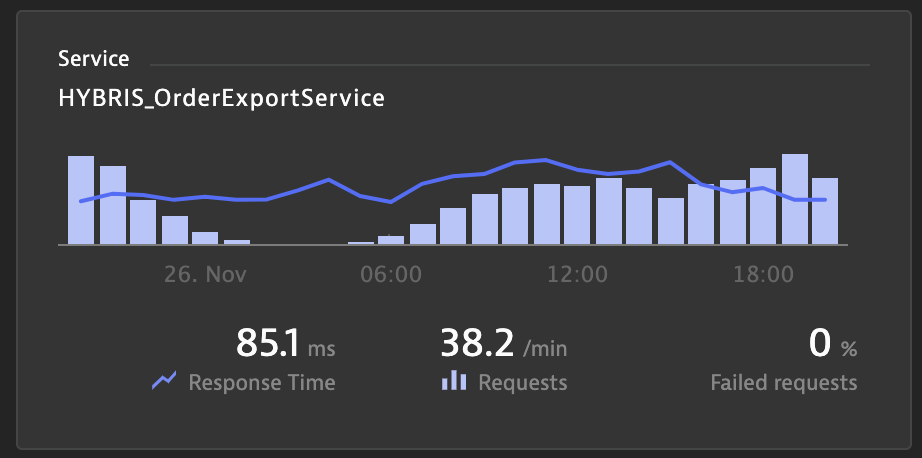
Especially for services you also might want to look into the service tile, which gives you a summary for a single service. Of course placing 50 of those on a dashboard ist too nice, but this could be a drilldown from eg the dashboard above.

Reinhard
- Mark as New
- Subscribe to RSS Feed
- Permalink
06 Oct 2021 02:09 PM
Can we show hosts from multiple Management zones in one tile ? Or is there any other option to achieve this.
- Mark as New
- Subscribe to RSS Feed
- Permalink
06 Oct 2021 02:15 PM
Hello,
You should be able to achieve this if you remove the MZ Filter in the Host Tile, apply a Tag to the Hosts you wish to see and then use that Tag value as your Filter.
Featured Posts
