- Dynatrace Community
- Ask
- Dashboarding
- Unable to filter dashboard graphs by process group instance key
- Subscribe to RSS Feed
- Mark Topic as New
- Mark Topic as Read
- Pin this Topic for Current User
- Printer Friendly Page
- Mark as New
- Subscribe to RSS Feed
- Permalink
05 Oct 2021
04:50 PM
- last edited on
31 May 2023
12:34 PM
by
![]() Michal_Gebacki
Michal_Gebacki
I use Dynatrace 1.222.86
- I created a dashboard, and defined a filter on a process group instance tag (called microservice)
- I also created a tag rule so that i apply microservice detected name automatically to the corresponding process groups instances
- process group instances have the following tag values : microservice:myMicroservice1, microservice:myMicroservice2, ...
- I added a custom graph (data explorer) that can be filtered by process group instance. When using data explorer, i can apply such a filter on a microservice and i see a good result. By default, no filter is applied of course.
Now when i display my dashboard, i can see the filter box and my chart. By default, this chart displays data aggregated for all the "microservices" (process group instances). This is expected.
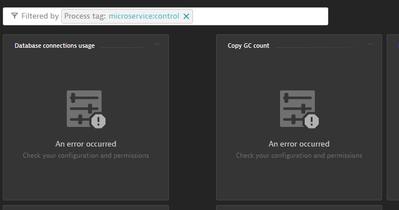
However, when i select a specific tag value in the filter box, then chart refreshes and shows me an error message (check the configuration of the permissions of the dashboard)
How can i solve this issue?
Solved! Go to Solution.
- Labels:
-
dashboards classic
-
process groups
-
tagging
- Mark as New
- Subscribe to RSS Feed
- Permalink
15 Oct 2021 09:28 PM - edited 15 Oct 2021 09:28 PM
can you share with us the metric you selected for the tile? I'm assuming that the filtering is not applicable for those custom charts.
- Mark as New
- Subscribe to RSS Feed
- Permalink
19 Oct 2021 10:45 AM
Hi @ChadTurner ,
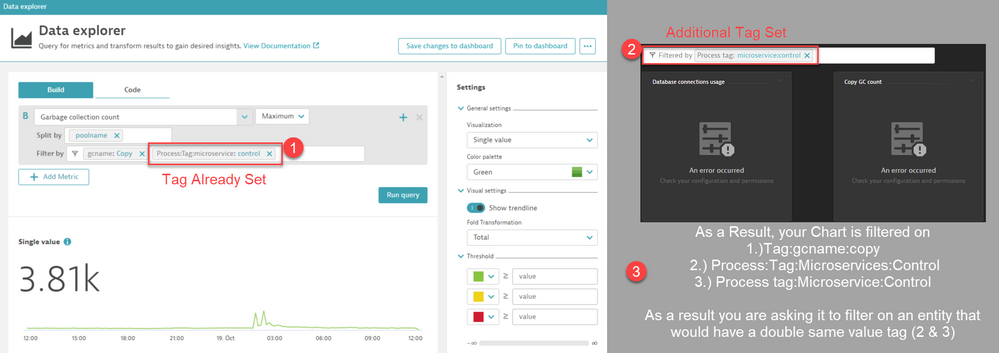
please find attached the screenshot. My custom charts have this Process tag (microservice) available. In the custom chart explorer, i can even select such a filter tag, apply it and the result is displayed fine.
Note : i even tested with 1.224 version of dynatrace but i obtain the same errors.
- Mark as New
- Subscribe to RSS Feed
- Permalink
19 Oct 2021 04:25 PM
Ahh I see what the issue is. you are double tagging. In the chart you have the same tag set as what you are putting in for the dashboard filter, and more then likely the entity doesn't have a double tag. You can test this by keeping one tile with the chart filter, then setting one without and using the dashboard filter.
Featured Posts


