- Dynatrace Community
- Ask
- Dashboarding
- DT Managed - Adjusting aggregation and timeframe
- Subscribe to RSS Feed
- Mark Topic as New
- Mark Topic as Read
- Pin this Topic for Current User
- Printer Friendly Page
- Mark as New
- Subscribe to RSS Feed
- Permalink
15 May 2017
06:12 PM
- last edited on
12 Jan 2022
12:08 PM
by
![]() AgataWlodarczyk
AgataWlodarczyk
Hello -
My enterprise is rolling out Dynatrace Managed internally, and one thing users have noticed is that data aggregation is automatically set depending on how large of a timeframe a user is looking at. For example, viewing a chart from a 2-hour timeframe will show some app server CPU's running up to 100%, however, when you change the timeframe to view 6 or 12 hours or more, the aggregation is automatically changed, and thus that 100% CPU spike may now look like 20% or less depending on how the aggregation was automatically changed.
While this may be useful and intended in some cases, it is not super intuitive to users and it would greatly improve analysis capabilities if there was a way to manually configure the aggregation level in addition to the timeframe. Is there currently a way to do this that I'm missing, or should I be submitting an enhancement request?
Thanks!
Andrew
Solved! Go to Solution.
- Labels:
-
cpu
-
dashboards classic
- Mark as New
- Subscribe to RSS Feed
- Permalink
16 May 2017 08:50 AM
Andrew,
we have a plan on the roadmap that will allow drilling into the details of most of the charts. That detail screen will show the chart fullscreen and will also allow to switch to different aggregations and resolutions. I think this should make it into the product in the next 6 month.
Andreas
- Mark as New
- Subscribe to RSS Feed
- Permalink
19 Jun 2018 01:52 PM
Hi Andrew!
You posted your request quite some time ago, so I'd like to check whether there is still an issue with CPU visually dropping to 20% upon changing the timeframe? If so, I'd love to see a screenshot, as I'm not aware of such an issue. As for customizing a charts resolution, we have that topic on our roadmap for Q4 2018.
Roman
- Mark as New
- Subscribe to RSS Feed
- Permalink
20 Jul 2022 11:31 PM
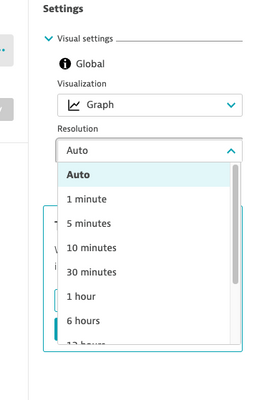
You can set a custom resolution using the Data explorer since version 1.235.
Featured Posts

