- Dynatrace Community
- Ask
- Dashboarding
- Data explorer not showing small values
- Subscribe to RSS Feed
- Mark Topic as New
- Mark Topic as Read
- Pin this Topic for Current User
- Printer Friendly Page
- Mark as New
- Subscribe to RSS Feed
- Permalink
04 Oct 2023 10:23 AM
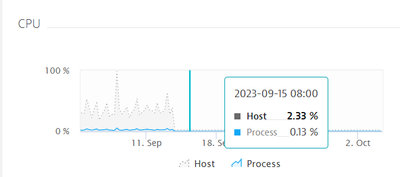
In a data explorer graph with the process CPU with some filters applied and split by process group instance and host: The 13th of September the CPU dropped a lot (expected behavior). However, even though some processes are still consuming small amounts of CPU, nothing appears in the graph.
This is one example:
And this is what the data explorer graph shows:
When the CPU is around 0.15% it doesn't show anything in the graph. Why is this? Is there a way to see this information even though the percentage is small?
Solved! Go to Solution.
- Labels:
-
dashboards classic
-
data explorer
- Mark as New
- Subscribe to RSS Feed
- Permalink
04 Oct 2023 12:09 PM
Hey @elenaperez ,
Seems like you are looking at two different metrics here. The one above is builtin:tech.generic.cpu.usage meanwhile the one below is builtin:process.cpu. If you were to chart in your dashboard the one above, the "small" numbers of that metric would show up in the dashboard as well. The other metric (builtin:process.cpu) has actually stopped being populated, at around the same time that there is the drop of CPU usage in your other metric.
So the problem is no longer charting small numbers, because of course the Data Explorer can do that, but why did the second metric (builtin:process.cpu) stop being populated so harshly for so many processes. For this, I don't have an answer, but hopefully someone else does, reads my comments and can add their more professional insights into why it could disappear.
Hopefully this helps.
Featured Posts


