- Dynatrace Community
- Ask
- Dashboarding
- Multiple Metrics on a honeycomb
- Subscribe to RSS Feed
- Mark Topic as New
- Mark Topic as Read
- Pin this Topic for Current User
- Printer Friendly Page
- Mark as New
- Subscribe to RSS Feed
- Permalink
05 Oct 2023 07:31 AM
I'm trying to run a query using Data Explorer that involves 2 separate metrics. The reason for this is because I want the different metrics to have differing thresholds. However, it will only let me run the query for 1 metric at a time, not both in conjunction, even though both are the same, just looking at different applications.
Is there a solution or way of being able to run 2 metrics together at the same time using a honeycomb in Data Explorer?
Solved! Go to Solution.
- Labels:
-
dashboards
-
data explorer
-
metrics
- Mark as New
- Subscribe to RSS Feed
- Permalink
05 Oct 2023 08:06 PM
Hi @uzahid,
It is not possible.
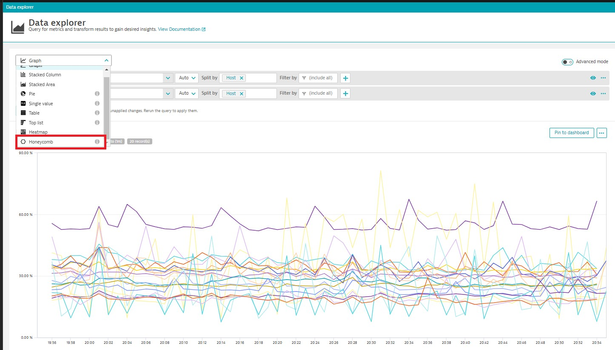
When you have already choosen your metrics and try to change the vizualization you can see an information about if you chose that vizualization there will be limitation eg. only one matric vizualization is possible.
Based on the documnetation:
"By default, this visualization shows the first metric of a multi-metric query."
https://www.dynatrace.com/support/help/shortlink/visualization-honeycomb#change-metric-selection
I hope it helps.
Best regards,
Mizső
- Mark as New
- Subscribe to RSS Feed
- Permalink
06 Oct 2023 12:45 PM
@Mizső is correct, just keep in mind, the older, original out of the box honeycombs take in multiple metrics. For example the honeycomb of host health and service health. That provides all infrastructure level metrics in a Green/Red Fashion honeycomb which you could leverage depending on your metric scope. Anything outside of that metric scope for the out of the box, original honeycomb, you are left with the data explorer result.
Featured Posts

