- Dynatrace Community
- Ask
- Dashboarding
- Re: Display custom metrics as Table view
- Subscribe to RSS Feed
- Mark Topic as New
- Mark Topic as Read
- Pin this Topic for Current User
- Printer Friendly Page
- Mark as New
- Subscribe to RSS Feed
- Permalink
16 Feb 2021
05:09 PM
- last edited on
31 Aug 2022
10:49 AM
by
![]() MaciejNeumann
MaciejNeumann
Hello
I try to display, in my dashboard, some custom business metrics (from a spring application with micrometer) as a table view.
For exemple, Dynatrace receives a metric with 3 tags
I want a table with 1 column by tag and the column 4 is the metric
and the line is updated each time receives the same 3 tag values. (I dont't know if I'm clear....)
For business information, the table view is better than graph for my case.
But I have found no way to do that, please help me !
Solved! Go to Solution.
- Labels:
-
dashboards classic
-
metrics
- Mark as New
- Subscribe to RSS Feed
- Permalink
18 Feb 2021 12:00 AM
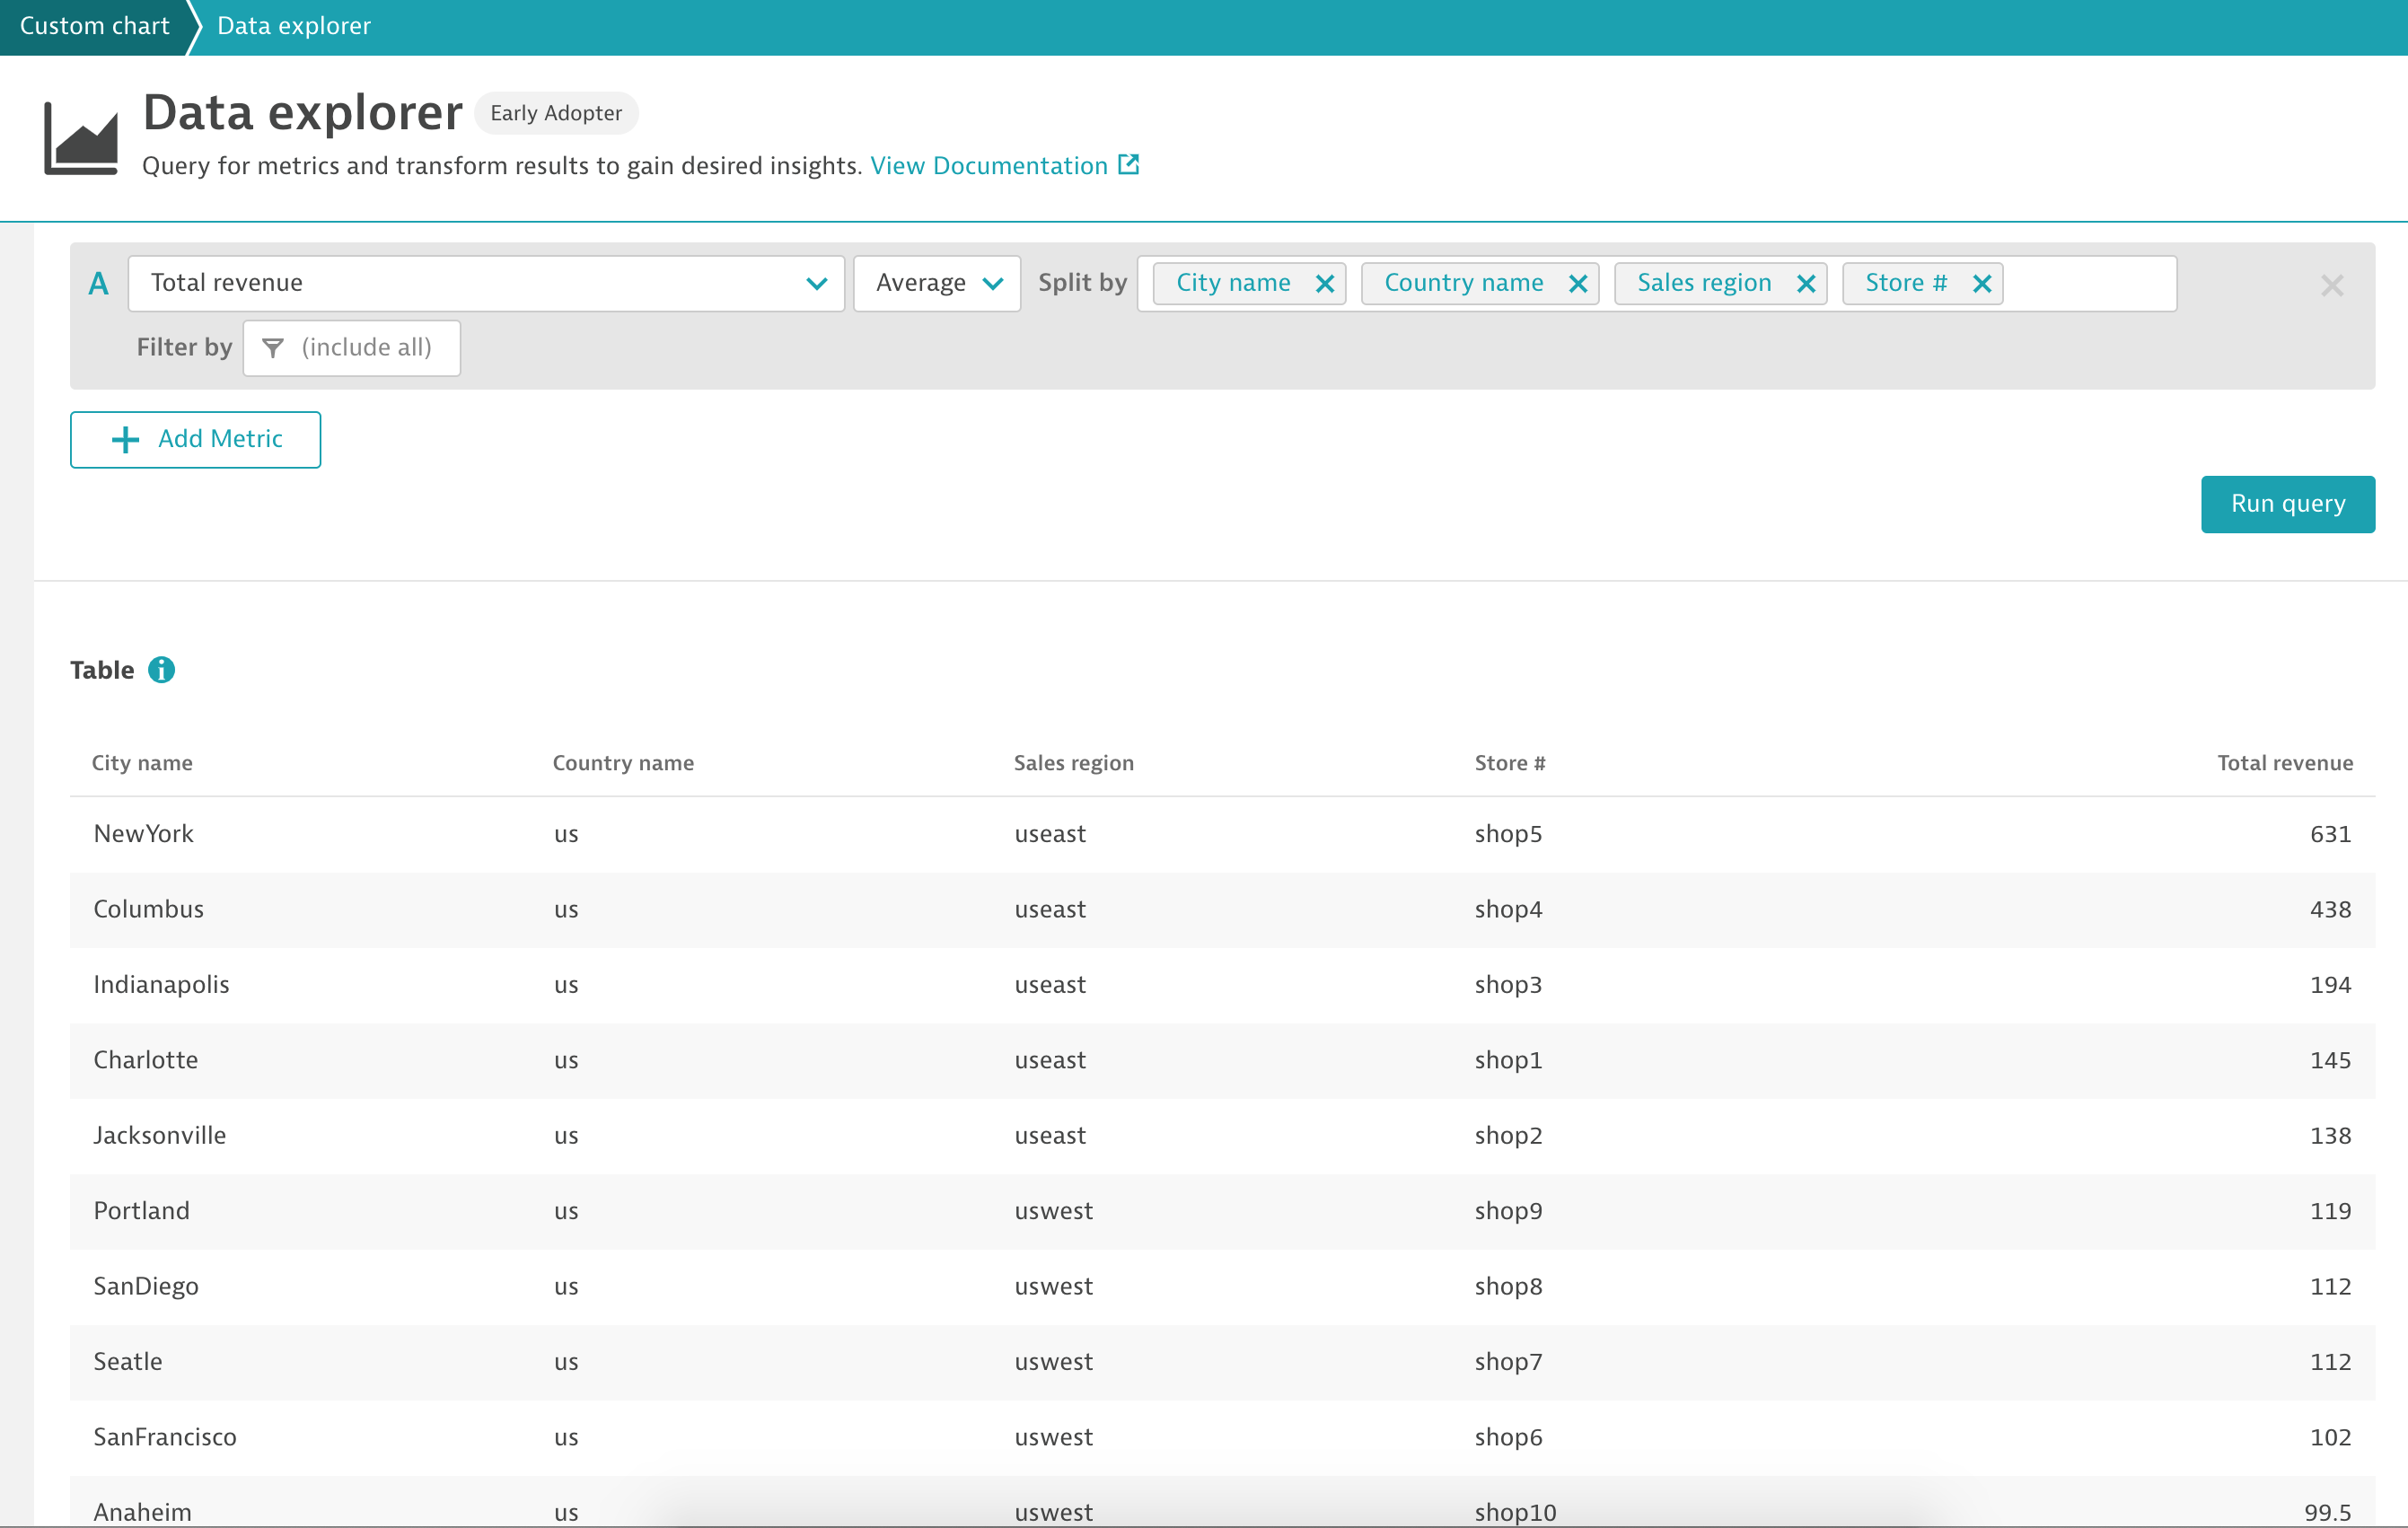
@Sylvie P. have to tried the new metrics explorer as it also has a new table view that you might find very useful.
- Mark as New
- Subscribe to RSS Feed
- Permalink
18 Feb 2021 09:58 AM
As @Chad T. already mentioned, the metric explorer supports a table view and you can split your results by the dimensions/tags / filter for and pin it to a dashboard
- Mark as New
- Subscribe to RSS Feed
- Permalink
18 Feb 2021 10:11 AM
Perfect, thanks a lot
I success to build the table but, I want to have a specific order on the column but, it's not the case
I have splited by : aorder, zotidate, cstart, dend, abtype (same order )
No filter
And in my table I have this column order : zotidate , cstart, dend, abtype,aorder, MyMetric
Any idea ?
Thanks in advance
- Mark as New
- Subscribe to RSS Feed
- Permalink
18 Feb 2021 12:13 PM
Hi @Sylvie P.
This is however something that we will be addressing so that the defined order of the splitBy is respected in the visualizations.
Featured Posts
