This website uses Cookies. Click Accept to agree to our website's cookie use as described in our Privacy Policy. Click Preferences to customize your cookie settings.
Dashboarding
Dynatrace dashboards, notebooks, and data explorer explained.
Turn on suggestions
Auto-suggest helps you quickly narrow down your search results by suggesting possible matches as you type.
- Community Home
- Platform
- Dashboarding
- Display custom metrics as Table view
Options
- Subscribe to RSS Feed
- Mark Topic as New
- Mark Topic as Read
- Pin this Topic for Current User
- Printer Friendly Page
Options
- Mark as New
- Subscribe to RSS Feed
- Permalink
16 Feb 2021
05:09 PM
- last edited on
31 Aug 2022
10:49 AM
by
![]() MaciejNeumann
MaciejNeumann
Hello
I try to display, in my dashboard, some custom business metrics (from a spring application with micrometer) as a table view.
For exemple, Dynatrace receives a metric with 3 tags
I want a table with 1 column by tag and the column 4 is the metric
and the line is updated each time receives the same 3 tag values. (I dont't know if I'm clear....)
For business information, the table view is better than graph for my case.
But I have found no way to do that, please help me !
Solved! Go to Solution.
Labels:
- Labels:
-
dashboards classic
-
metrics
Reply
4 REPLIES 4
Options
- Mark as New
- Subscribe to RSS Feed
- Permalink
18 Feb 2021 12:00 AM
@Sylvie P. have to tried the new metrics explorer as it also has a new table view that you might find very useful.
-Chad
Options
- Mark as New
- Subscribe to RSS Feed
- Permalink
18 Feb 2021 09:58 AM
As @Chad T. already mentioned, the metric explorer supports a table view and you can split your results by the dimensions/tags / filter for and pin it to a dashboard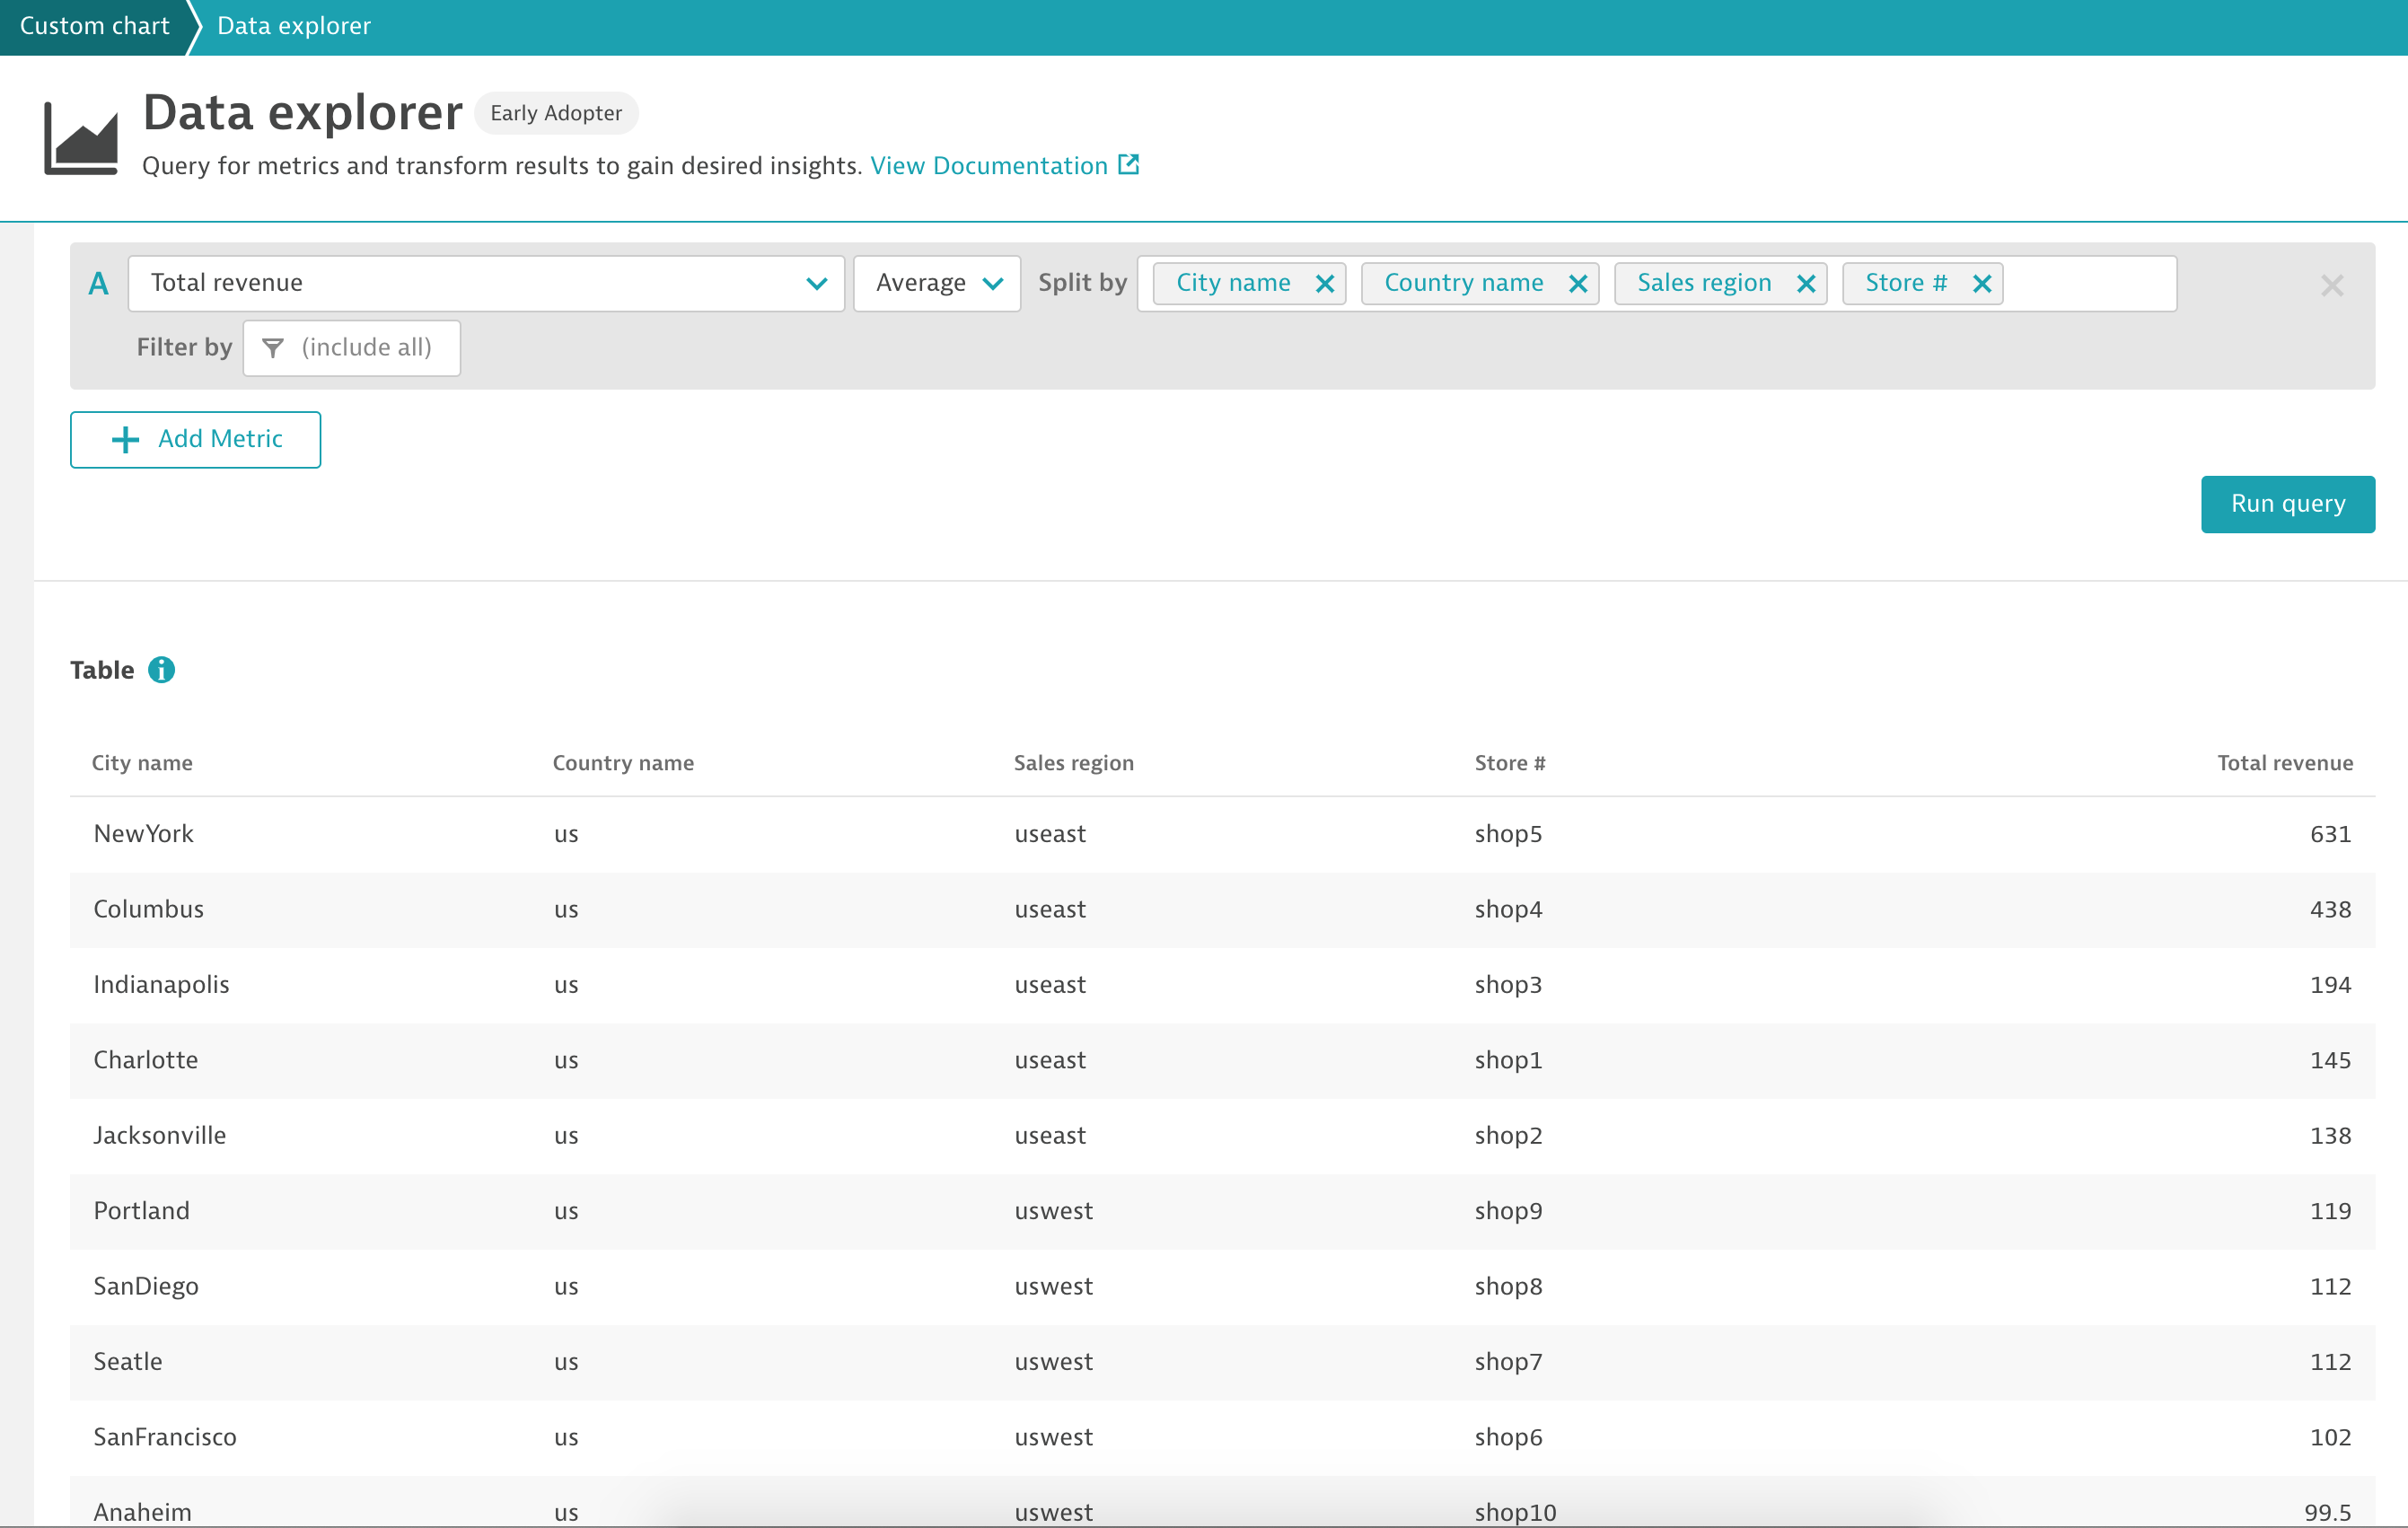
Options
- Mark as New
- Subscribe to RSS Feed
- Permalink
18 Feb 2021 10:11 AM
Perfect, thanks a lot
I success to build the table but, I want to have a specific order on the column but, it's not the case
I have splited by : aorder, zotidate, cstart, dend, abtype (same order )
No filter
And in my table I have this column order : zotidate , cstart, dend, abtype,aorder, MyMetric
Any idea ?
Thanks in advance
Options
- Mark as New
- Subscribe to RSS Feed
- Permalink
18 Feb 2021 12:13 PM
Hi @Sylvie P.
The dimensions hierarchy decides the order. For each metric there are like primary dimension, secondary dimension etc.
So even in the splitBy those are specified in a certain order, the order returned always depend on that hierarchyThis is however something that we will be addressing so that the defined order of the splitBy is respected in the visualizations.
Featured Posts
