- Dynatrace Community
- Ask
- Dashboarding
- Re: Distribution graph and/or tables in Data explorer - eg Host Availability
- Subscribe to RSS Feed
- Mark Topic as New
- Mark Topic as Read
- Pin this Topic for Current User
- Printer Friendly Page
- Mark as New
- Subscribe to RSS Feed
- Permalink
08 Feb 2024 08:29 AM
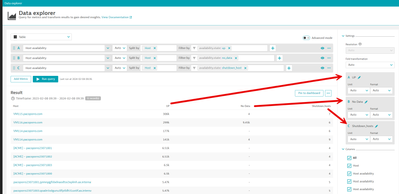
I want to show a table with Host Availability using the newer Host Availability metric with buckets for each state. A table for each host showing percentage of Up, no_data, shutdown_host etc
When using Splity By Host and availablity_state I just get multiple lines for each state. Plus I want to get the result in %, not number of measuring points per state
Anyone else fixed this?
Solved! Go to Solution.
- Labels:
-
dashboards
-
data explorer
- Mark as New
- Subscribe to RSS Feed
- Permalink
08 Feb 2024 08:40 AM
Are you looking for something like this?
- Mark as New
- Subscribe to RSS Feed
- Permalink
08 Feb 2024 09:12 AM
Yes, but even better if there was a Percentage number for each. I tried but failed so far with the calculation (in advanced mode)
This is quite good, my plan B
thanks
Featured Posts

