This website uses Cookies. Click Accept to agree to our website's cookie use as described in our Privacy Policy. Click Preferences to customize your cookie settings.
Dashboarding
Dynatrace dashboards, notebooks, and data explorer explained.
Turn on suggestions
Auto-suggest helps you quickly narrow down your search results by suggesting possible matches as you type.
- Community Home
- Platform
- Dashboarding
- How should work dashboard tile filtering by Request Attribute ?
Options
- Subscribe to RSS Feed
- Mark Topic as New
- Mark Topic as Read
- Pin this Topic for Current User
- Printer Friendly Page
Options
- Mark as New
- Subscribe to RSS Feed
- Permalink
29 Jul 2020 12:49 PM
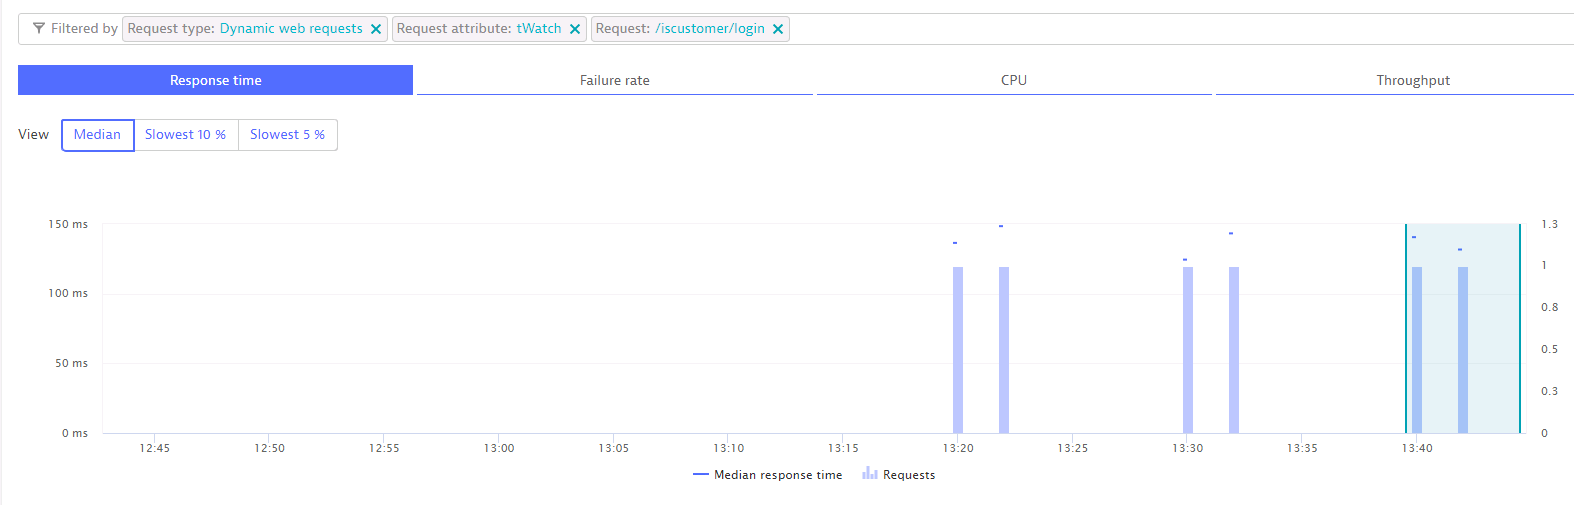
I created Request Attribute tWatch which is marking requests coming from specific 3rd party tool (Synthetic). Idea was to filter dashboard tiles with key requests via this attribute.
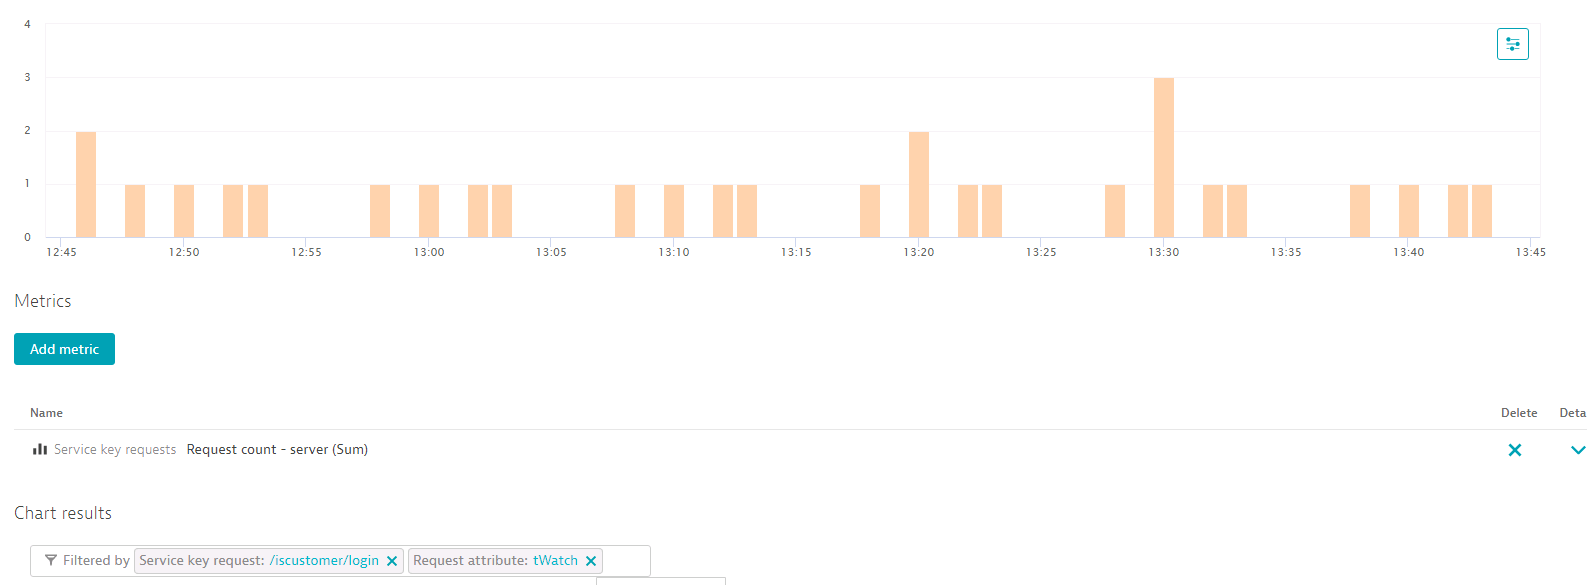
In service view filtering works - but in dashboard tile/custom chart the filter doesn't have any effect - means chart is containing all requests.
Solved! Go to Solution.
Labels:
- Labels:
-
dashboards classic
-
request attributes
7 REPLIES 7
Options
- Mark as New
- Subscribe to RSS Feed
- Permalink
29 Jul 2020 01:20 PM
@josef S. You wont be able to pin the multidimensional chart to the dashboard. You can place it in the diagnostic tools that is found on the left hand side of the navigation chart.
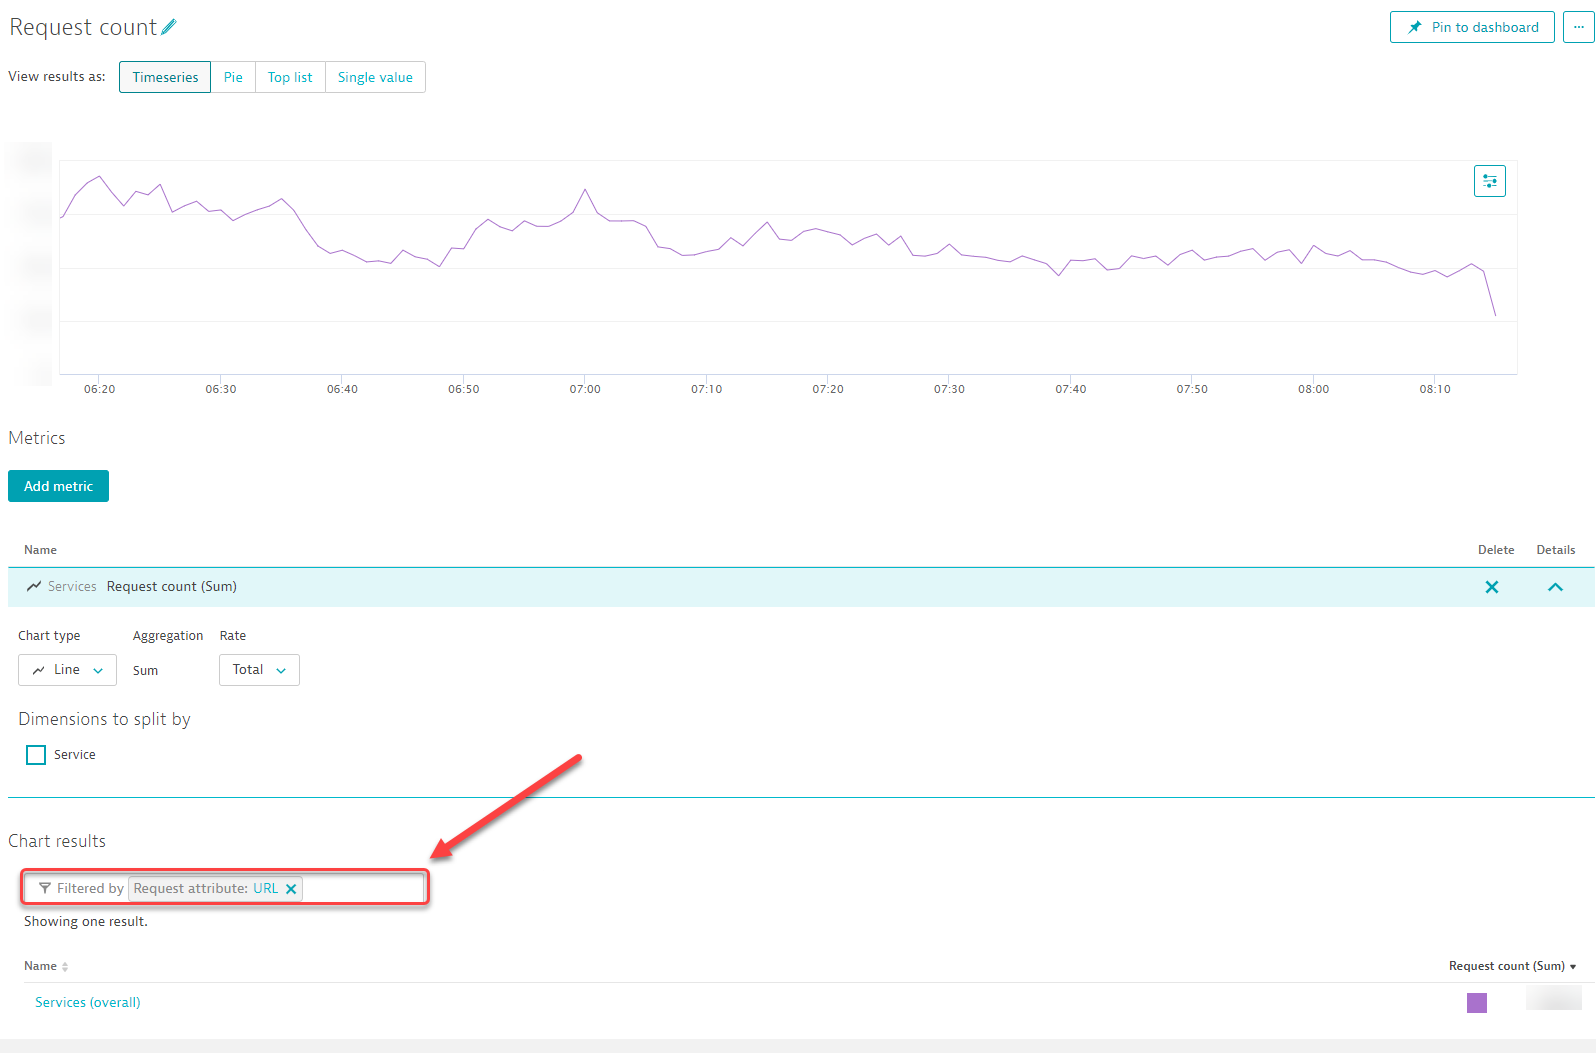
You can create a custom chart that filters off of service and then filter it down to the request attribute, but it might not allow you to get as granular as you have in the multidimensional chart.
-Chad
Reply
Options
- Mark as New
- Subscribe to RSS Feed
- Permalink
29 Jul 2020 01:50 PM
Thank you Chad - but for custom chart the request attribute is not filtering down anything 😞
Dynatrace managed - 1.196.71.20200702-184254
Options
- Mark as New
- Subscribe to RSS Feed
- Permalink
29 Jul 2020 01:52 PM
ahh okay, So I am on 198 as the latest version, Managed is 2 weeks behind SaaS in deployments. Wait until you update then give it a try and if not, then I would open up a support ticket because If i can do it at V.198 then you should as well on 198.
-Chad
Options
- Mark as New
- Subscribe to RSS Feed
- Permalink
07 Aug 2020 06:19 AM
Hi,
looks - in 1.198.87 the tile filtering by request attributes works 🙂
Interesting ...
Reply
Options
- Mark as New
- Subscribe to RSS Feed
- Permalink
22 Nov 2021 09:09 AM
Hello Guys
Question, can we build the same chart but splitting by the request attributes?
Also, is there any way to count how much different request attributes we have?
Thanks.
Sharing Knowledge
Options
- Mark as New
- Subscribe to RSS Feed
- Permalink
22 Nov 2021 12:37 PM
I can answer your last question. Using API you can list all your Request Attributes and count them from there: https://www.dynatrace.com/support/help/dynatrace-api/configuration-api/service-api/request-attribute...
Site Reliability Engineer @ Kyndryl
Options
- Mark as New
- Subscribe to RSS Feed
- Permalink
22 Nov 2021 01:51 PM
Thank you
But I search for a way to do this from the UI and present in Dashboard.
Sharing Knowledge
Featured Posts
