This website uses Cookies. Click Accept to agree to our website's cookie use as described in our Privacy Policy. Click Preferences to customize your cookie settings.
Dashboarding
Dynatrace dashboards, notebooks, and data explorer explained.
Turn on suggestions
Auto-suggest helps you quickly narrow down your search results by suggesting possible matches as you type.
- Community Home
- Platform
- Dashboarding
- How to create CPU usage dashboard
Options
- Subscribe to RSS Feed
- Mark Topic as New
- Mark Topic as Read
- Pin this Topic for Current User
- Printer Friendly Page
Options
- Mark as New
- Subscribe to RSS Feed
- Permalink
28 Jan 2019
11:38 AM
- last edited on
06 May 2021
03:55 PM
by
![]() MaciejNeumann
MaciejNeumann
How to create CPU usage dashboard using aggregation "MAX" in dynatrace SAAS/Managed...
Solved! Go to Solution.
Labels:
- Labels:
-
dashboards classic
1 REPLY 1
Options
- Mark as New
- Subscribe to RSS Feed
- Permalink
12 Feb 2020 04:35 PM
This can be done by creating a custom chart. Select "Create custom chart" on the left hand side, Type in CPU and select the option as desired, then once the chart comes up, select the aggregation of Maximum. From there you should be all set, dont forget to pin it to the desired dashboard!
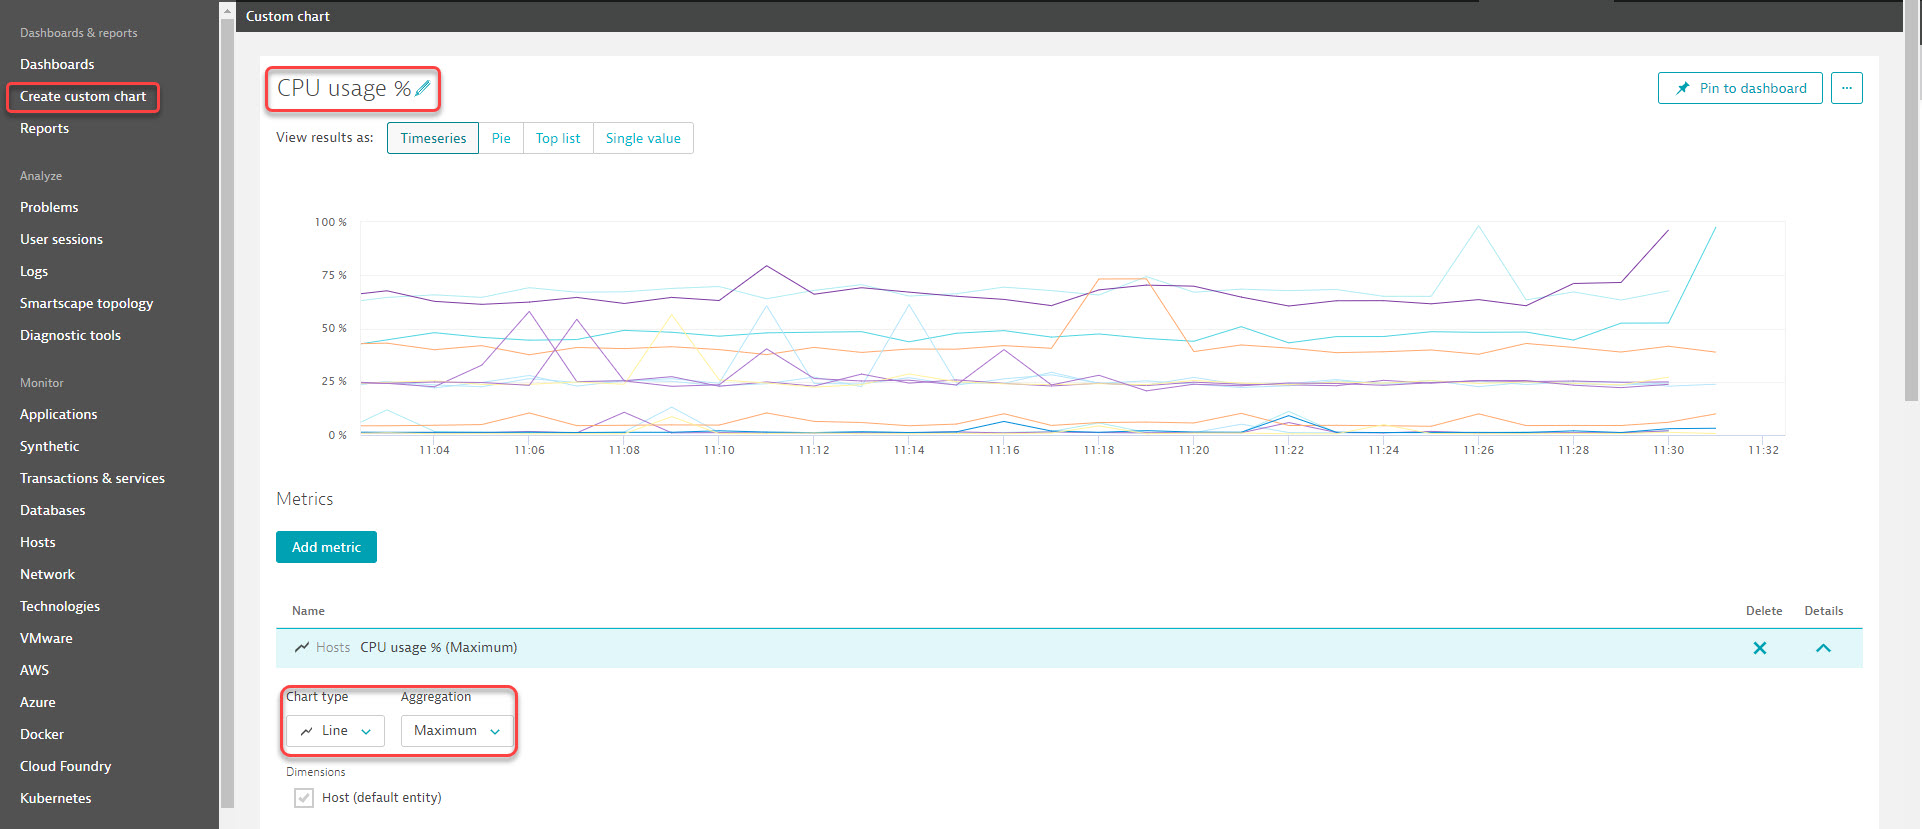
-Chad
Reply
Featured Posts
