This website uses Cookies. Click Accept to agree to our website's cookie use as described in our Privacy Policy. Click Preferences to customize your cookie settings.
Dashboarding
Dynatrace dashboards, notebooks, and data explorer explained.
Turn on suggestions
Auto-suggest helps you quickly narrow down your search results by suggesting possible matches as you type.
- Community Home
- Platform
- Dashboarding
- How to create customchart for fronetend(client) time?
Options
- Subscribe to RSS Feed
- Mark Topic as New
- Mark Topic as Read
- Pin this Topic for Current User
- Printer Friendly Page
Options
- Mark as New
- Subscribe to RSS Feed
- Permalink
20 Apr 2020
08:46 PM
- last edited on
06 May 2021
02:13 PM
by
![]() MaciejNeumann
MaciejNeumann
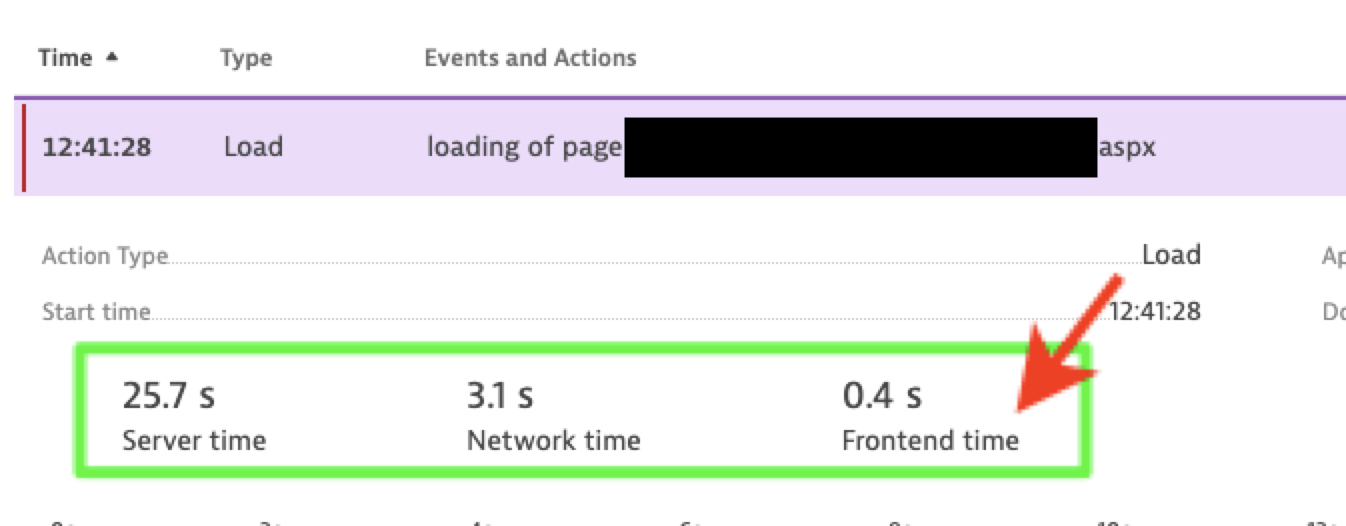
Hi, I am looking for frontend time(client time) to plot in a custom chart. Please let me know what is the metric need to select (if there is one) Please see the screenshots below, I am able to capture Network time, Server time, the only thing missing here is Frontend time (screenshot#2)
Screenshot#1 - this is from user actions
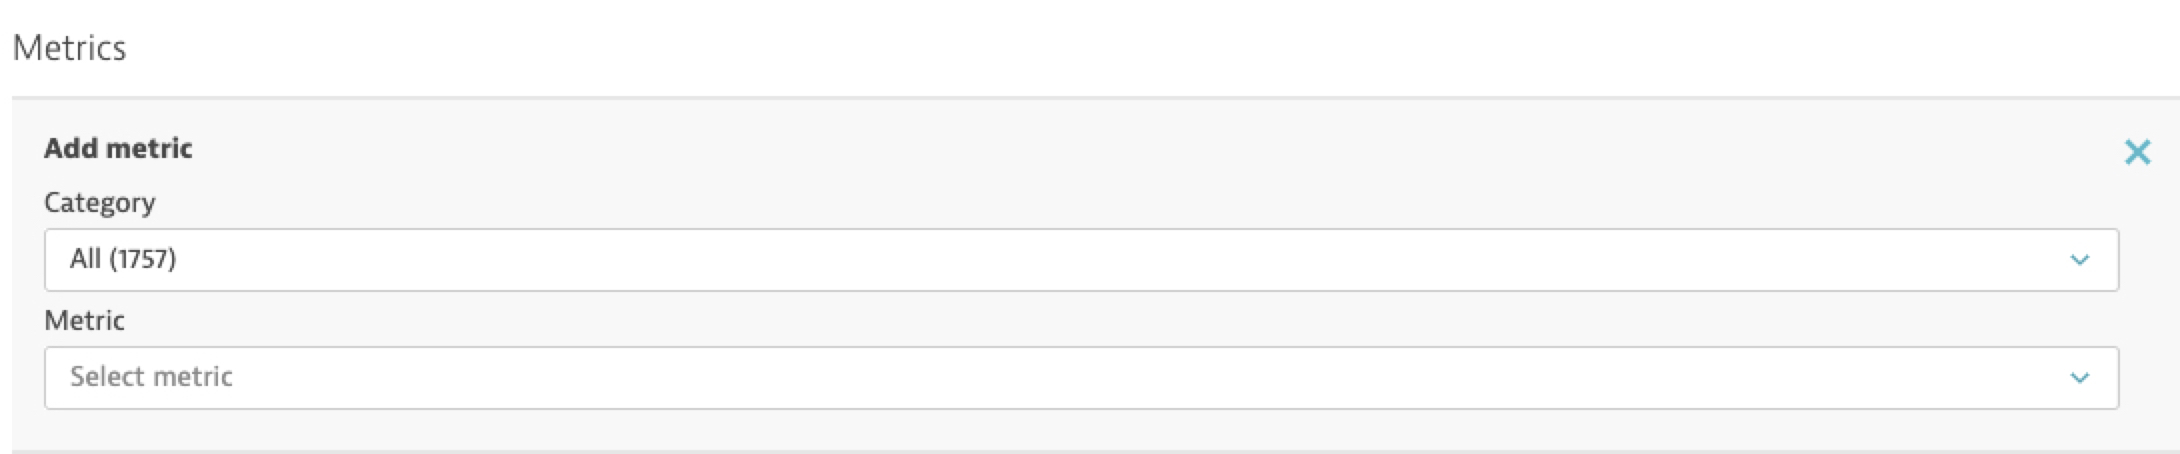
Screenshot#2 - Below screenshot is from custom chart, can't find the metric for frontendtime
Solved! Go to Solution.
13 REPLIES 13
Options
- Mark as New
- Subscribe to RSS Feed
- Permalink
20 Apr 2020 09:00 PM
@Suresh K., YES! this can be done via the User Session SQL:
Let me know if you need a hand with this.
-Chad
Reply
Options
- Mark as New
- Subscribe to RSS Feed
- Permalink
20 Apr 2020 09:05 PM
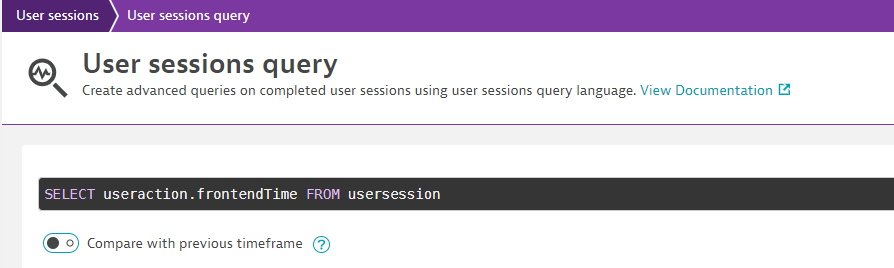
Thanks @Chad T., I am able to do it using USQL. Could you let me know how I can plot it in a custom chart and eventually pin that in Dashboard? I am specifically looking for an option for Frontendtime here, could you let me know if there is one available?
Options
- Mark as New
- Subscribe to RSS Feed
- Permalink
20 Apr 2020 09:08 PM
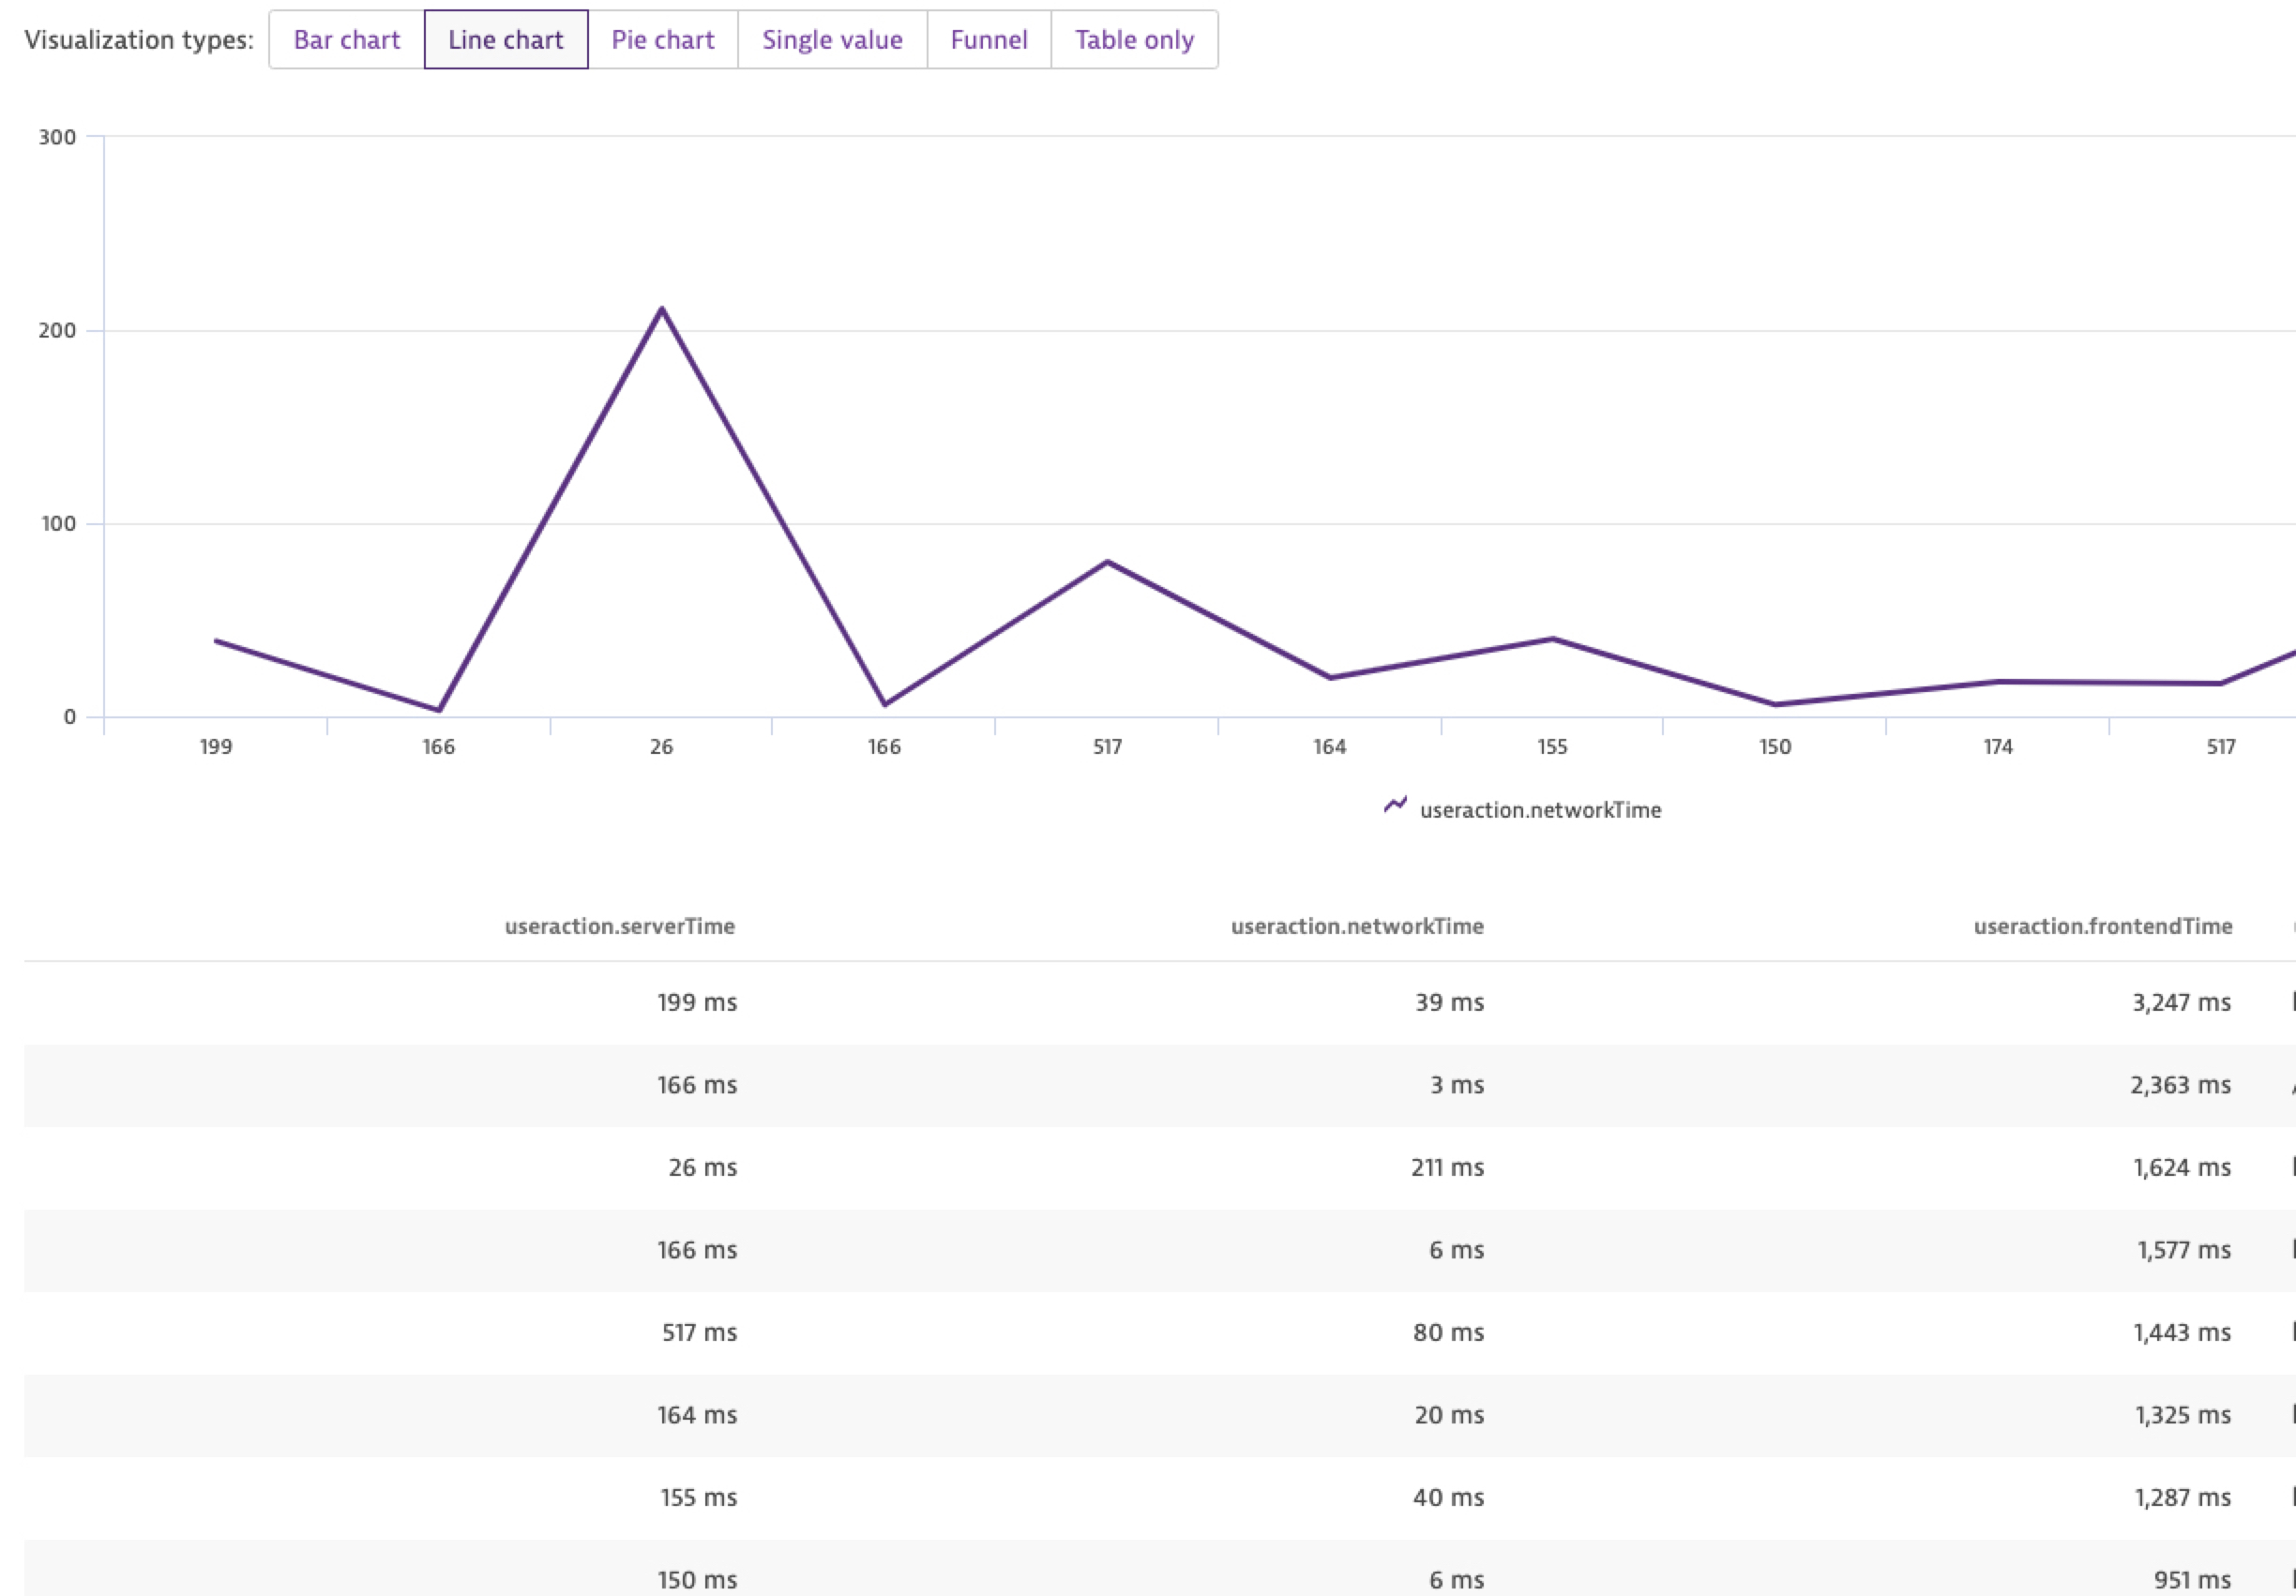
for this you will need to do it from the User Sessions Section of Dynatrace. You will also be able to pin the results to the dashboard of your choosing. You can have multiple types of graphs as well.
-Chad
Reply
Options
- Mark as New
- Subscribe to RSS Feed
- Permalink
20 Apr 2020 09:13 PM
here is a sample of one: 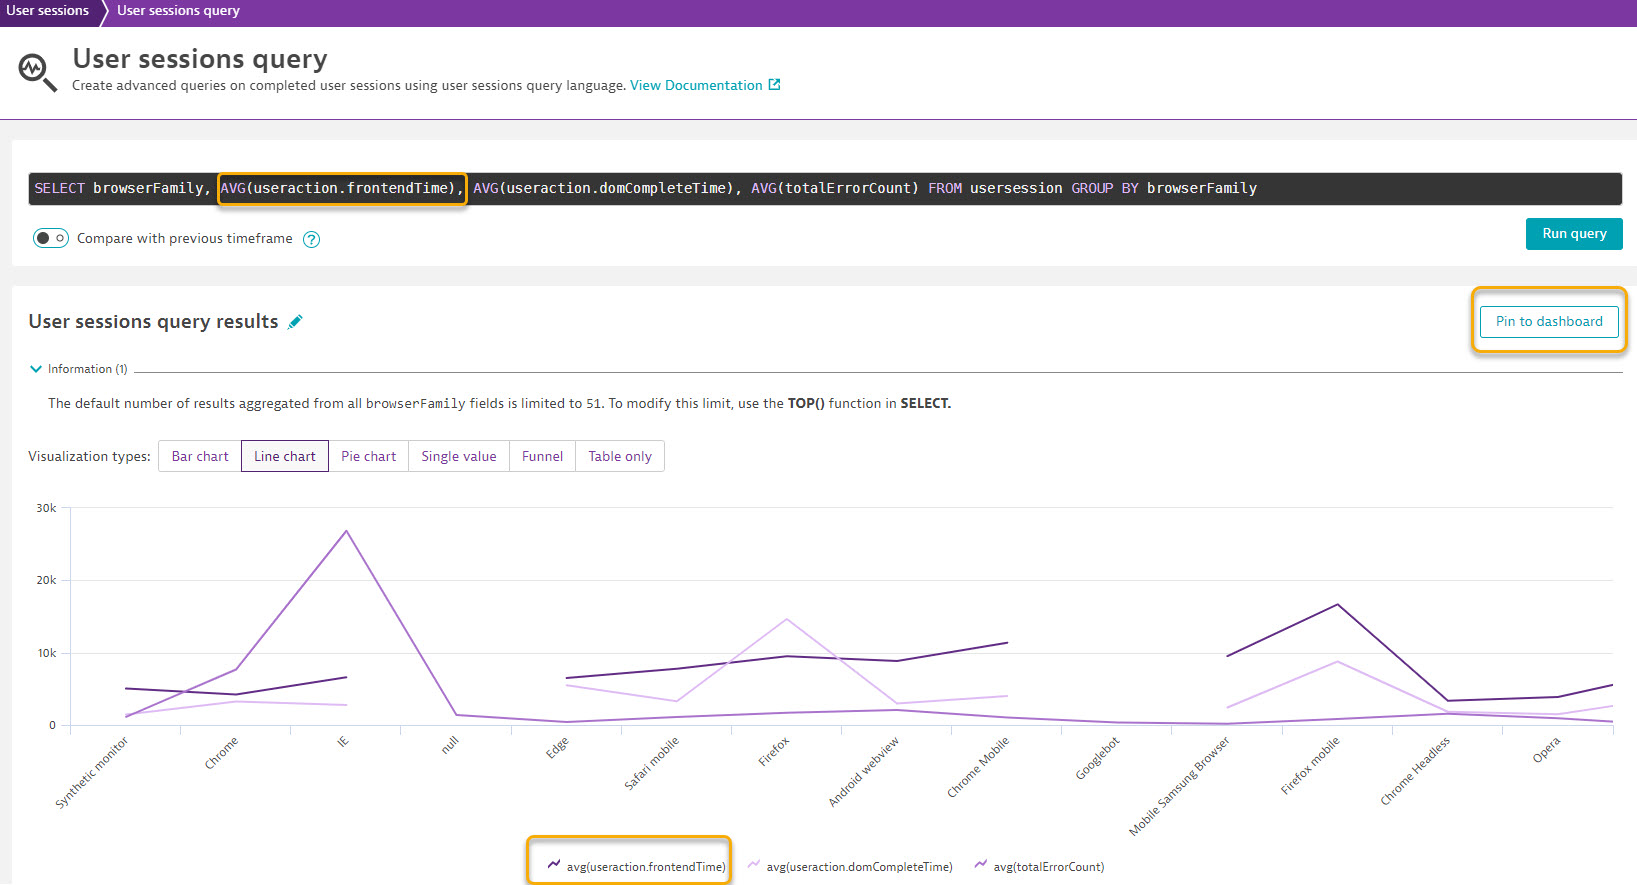
-Chad
Reply
Options
- Mark as New
- Subscribe to RSS Feed
- Permalink
20 Apr 2020 09:19 PM
thanks @Chad T., so User session query is the only place to build this? challenge with that is, I can't drill down to the user actions from the results. If I am able to plot the same using custom chart, I can do the drill-down directly from the chart by filtering with Dimension. And can't do the same from User session query page. So, question is, since I am able to find network contribution, Server time from custom chart metrics, why I am not able to see one for Frontend time? I am not sure if there is an inbuilt metric available for this. Appreciate if you point me in the right direction. Thanks, Suresh.
Options
- Mark as New
- Subscribe to RSS Feed
- Permalink
20 Apr 2020 09:23 PM
if you really want to be able to jump right into the user session from the USQL results, that can be done quite simply. the graph will also provide you a table under and you can filter/sort/group/list by user.
-Chad
Reply
Options
- Mark as New
- Subscribe to RSS Feed
- Permalink
20 Apr 2020 09:28 PM
The magnifying glass allows you to jump right into that session that is providing you with the metric:
-Chad
Reply
Options
- Mark as New
- Subscribe to RSS Feed
- Permalink
20 Apr 2020 09:41 PM
@Chad T. I just developed this query, not able to find the magnifying glass at all.
Saas Version 1.191. Am I missing something here?

Reply
Options
- Mark as New
- Subscribe to RSS Feed
- Permalink
20 Apr 2020 09:42 PM
yeah, let me work it a bit on my end and see if I can get it to pop up
-Chad
Reply
Options
- Mark as New
- Subscribe to RSS Feed
- Permalink
20 Apr 2020 10:37 PM
SO it appears that once we go a GROUP BY, the system removed the link to the user session.
-Chad
Reply
Options
- Mark as New
- Subscribe to RSS Feed
- Permalink
20 Apr 2020 09:14 PM
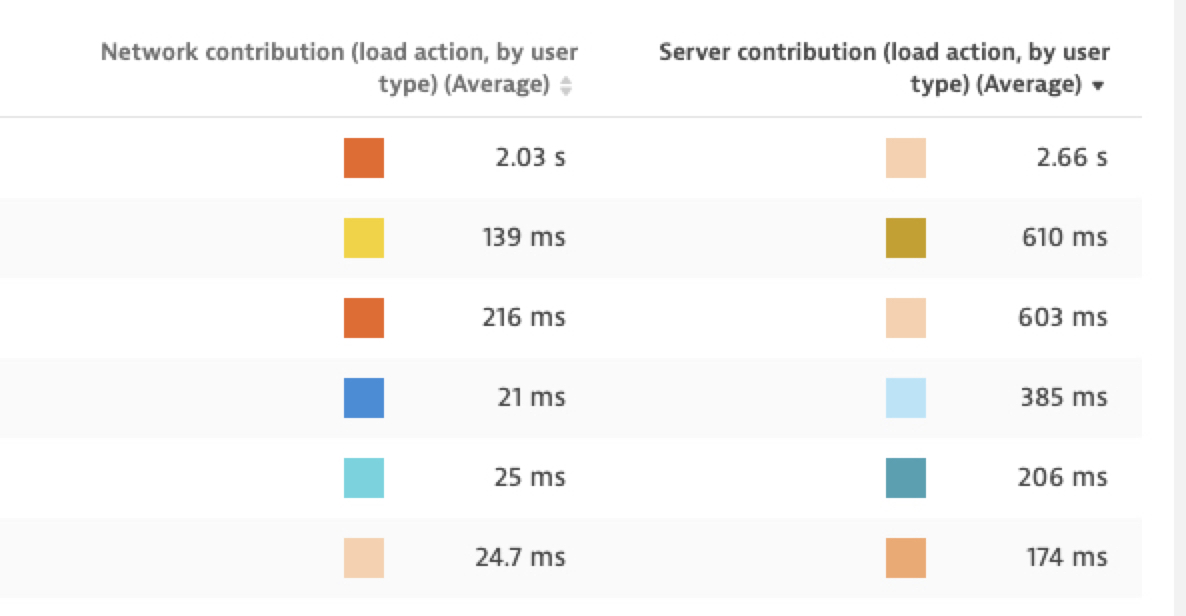
Hmm. @Chad T., see the below values, these are captured from the out of the box available metrics in Dynatrace. Similar to this, I am wondering why I am not able to find the metric for Frontend time? If there is one available, could you help me in providing that. If there is no metric available for that, appreciate if you give suggestion on how to build a custom metric for Frontend time?
1587413577083.png
66 KB
Options
- Mark as New
- Subscribe to RSS Feed
- Permalink
20 Apr 2020 09:18 PM
as of now, the only way to do this is via the USQL - you could put in a RFE for this to be included in the custom charts. But for now you will have to resort to making a custom tile via the USQL statements
-Chad
Reply
Featured Posts
