- Dynatrace Community
- Ask
- Dashboarding
- How to list active processes on the dashboard?
- Subscribe to RSS Feed
- Mark Topic as New
- Mark Topic as Read
- Pin this Topic for Current User
- Printer Friendly Page
- Mark as New
- Subscribe to RSS Feed
- Permalink
09 Mar 2022
09:30 AM
- last edited on
25 May 2023
01:43 PM
by
![]() Michal_Gebacki
Michal_Gebacki
Dear Dynatrace Gurus,
I would like to seek your assistance on how I can create a honeycomb that depicts the status of the process. Say that one of the processes is down so it will automatically be shown as red among the services in the honeycomb. Is this possible?
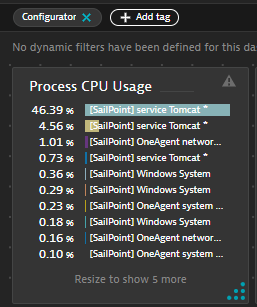
At the moment I've managed to find only the process CPU usage as shown in the below screenshot. Appreciate it if you guys can shed some light on how I can achieve this.
Thank you so much for helping out.
Thanks,
Regards,
Afrezal Karim
Solved! Go to Solution.
- Labels:
-
dashboards classic
-
processes
- Mark as New
- Subscribe to RSS Feed
- Permalink
10 Mar 2022 03:07 AM
Hey Afrezal,
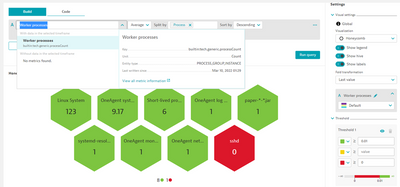
I had a bit of a look through and found the builtin:tech.generic.processCount metric which can be used to see how many instances of a process exist. In conjunction with the CPU usage metric you should be able to get a pretty good idea of the status of your processes. Below you can see how I set this up.
This is the setup in data explorer. Ensure you have the fold transformation set to "Last Value" so that its not the average during your selected timeframe but instead the last reported value.
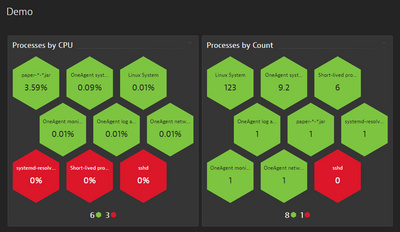
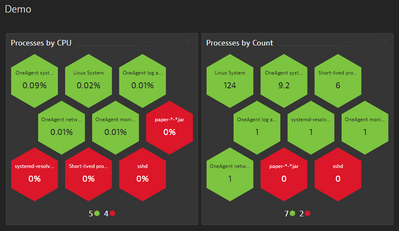
Note the paper process is currently running in the above picture. In the next one it's shutdown so you can see how it looks.
Hopefully this helps!
- Mark as New
- Subscribe to RSS Feed
- Permalink
21 Apr 2023 08:02 PM
This is good as long as the timeframe you are viewing is larger then the amount of time the process has been stopped. Once the process stops then this builtin:tech.generic.processCount metric stops reporting data. If for example it has been stopped for 15 mins but you are viewing in the last 5 mins then it won't show on the dashboard tile.
Had a use case for this today and this is what I was finding when testing.
- Mark as New
- Subscribe to RSS Feed
- Permalink
22 Apr 2023 04:37 PM
Looks great. Thank you for sharing!
- Mark as New
- Subscribe to RSS Feed
- Permalink
16 Mar 2022 04:23 AM
Hello Fin,
Thank you so much for responding to my issue. This looks pretty awesome. I will definitely try on my end to see how it works.
Thanks again for helping out. I really appreciate it.
You Rocks !! 😎
Thanks, regards,
Afrezal Karim
Featured Posts


