This website uses Cookies. Click Accept to agree to our website's cookie use as described in our Privacy Policy. Click Preferences to customize your cookie settings.
Dashboarding
Dynatrace dashboards, notebooks, and data explorer explained.
Turn on suggestions
Auto-suggest helps you quickly narrow down your search results by suggesting possible matches as you type.
- Community Home
- Platform
- Dashboarding
- Hung Threads and connection pool for .NET applications
Options
- Subscribe to RSS Feed
- Mark Topic as New
- Mark Topic as Read
- Pin this Topic for Current User
- Printer Friendly Page
Options
- Mark as New
- Subscribe to RSS Feed
- Permalink
09 Apr 2018
04:42 PM
- last edited on
31 Aug 2022
11:02 AM
by
![]() MaciejNeumann
MaciejNeumann
Hi,
I would like to chart hung threads and connection pool size for .NET applications in dynatrace.Can someone help me with this.
Thanks,
Solved! Go to Solution.
Labels:
- Labels:
-
data explorer
-
dotnet
4 REPLIES 4
Options
- Mark as New
- Subscribe to RSS Feed
- Permalink
09 Apr 2018 07:47 PM
What metrics are available now will be available if you browse through the options under "create custom chart" or by drilling into the details for a given process:
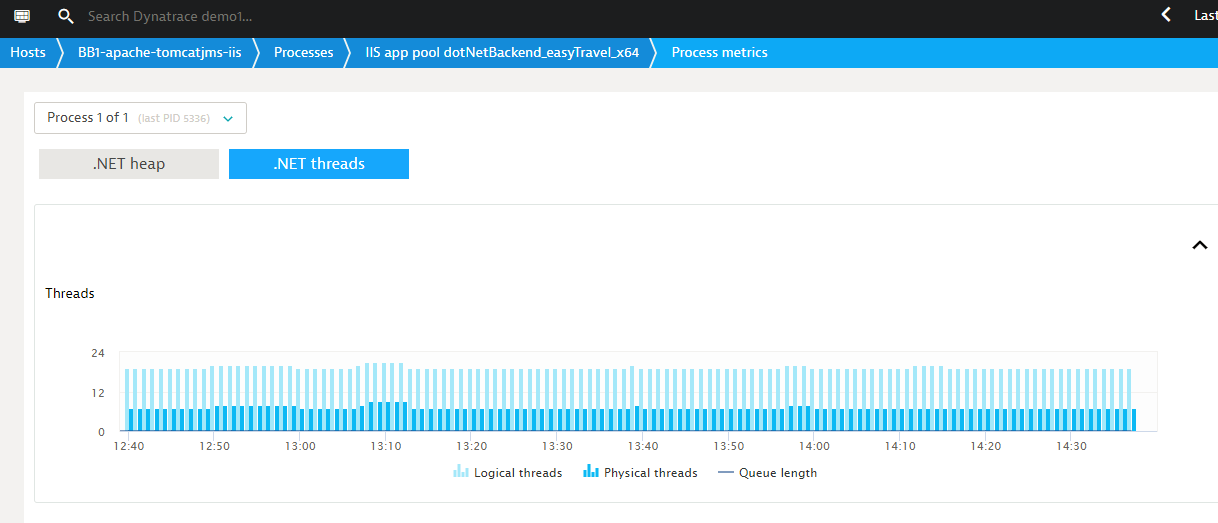
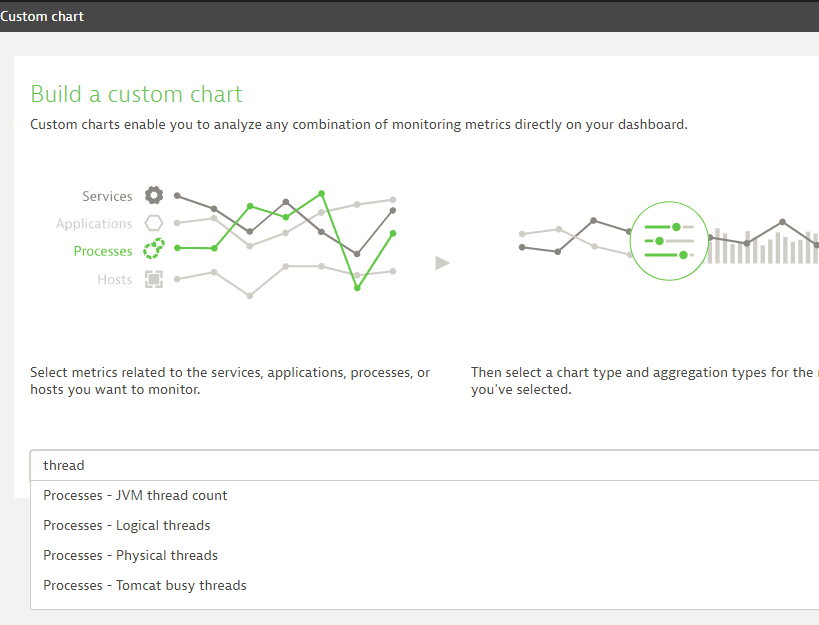
At least in our demo I don't see anything for hung threads.
James
Options
- Mark as New
- Subscribe to RSS Feed
- Permalink
05 Apr 2019 02:26 PM
With OneAgent 1.165, there are new .NET Thread Pool metrics, that would show you a starvation of threads in the thread pool. .NET Core 2.0+ only.

Reply
Options
- Mark as New
- Subscribe to RSS Feed
- Permalink
24 Apr 2019 08:10 PM
@Christoph N.I got a request from a prospect in a PoC for a rather big deal if we can also show the thread contention rate? (apparently the competing product can show it and they are very into this particular metric)
Options
- Mark as New
- Subscribe to RSS Feed
- Permalink
20 Mar 2024 04:32 PM
I am running a .Net 6 app and we have min/max threadpool settings as 100/250. our graph in dynatrace shows a fraction of an active worker thread usually. Why is that?
Featured Posts
