- Dynatrace Community
- Ask
- Dashboarding
- Re: Is it possible to chart a specific exception over time in dynatrace?
- Subscribe to RSS Feed
- Mark Topic as New
- Mark Topic as Read
- Pin this Topic for Current User
- Printer Friendly Page
- Mark as New
- Subscribe to RSS Feed
- Permalink
29 Sep 2019 02:12 PM
hi All,
Am trying to chart a specific exception occuring over time in a service like we can achieve it in Appmon by creating measure. If anyone was able to achieve it please let me know how to do it in Dynatrace?
Thanks
Sreedhar
Solved! Go to Solution.
- Labels:
-
dashboards classic
- Mark as New
- Subscribe to RSS Feed
- Permalink
29 Sep 2019 02:54 PM
In Dynatrace it is not possible so far.
Sebastian
- Mark as New
- Subscribe to RSS Feed
- Permalink
29 Sep 2019 06:04 PM
Thanks Sebastian!
Have submitted an RFE incase other also would like to have this in dynatrace -RFE - Ability to chart a specific exception over time in dynatrace"
- Mark as New
- Subscribe to RSS Feed
- Permalink
04 Oct 2019 08:18 PM
Hello Sreedhar,
I'm not sure if you are aware, but you have a view in Dynatrace where you can filter the exception and chart it over time, but this view won't be refreshed and you can't pin it to a dashboard as a dashlet.
Go to the specific service -> "View dynamic requests" -> "View exception analysis" -> filter by the exception you want.
Regards,
Felipe
- Mark as New
- Subscribe to RSS Feed
- Permalink
24 Mar 2020 10:18 AM
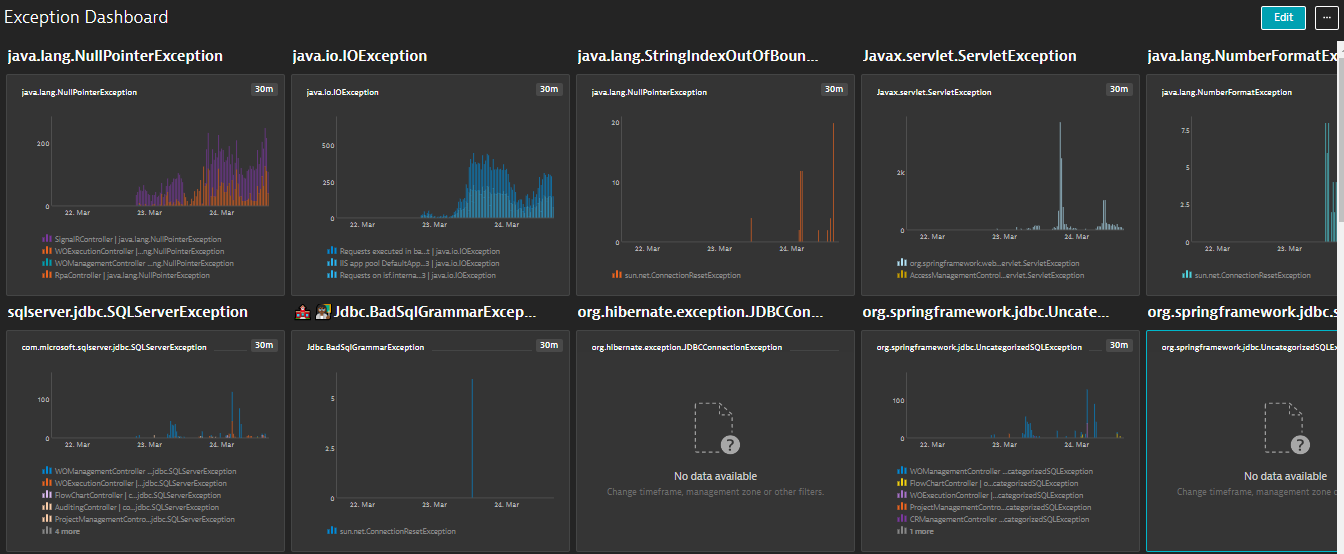
Something Like This?
- Mark as New
- Subscribe to RSS Feed
- Permalink
30 Jun 2020 05:37 AM
Which metrics did you use ??
- Mark as New
- Subscribe to RSS Feed
- Permalink
30 Jun 2020 06:42 AM
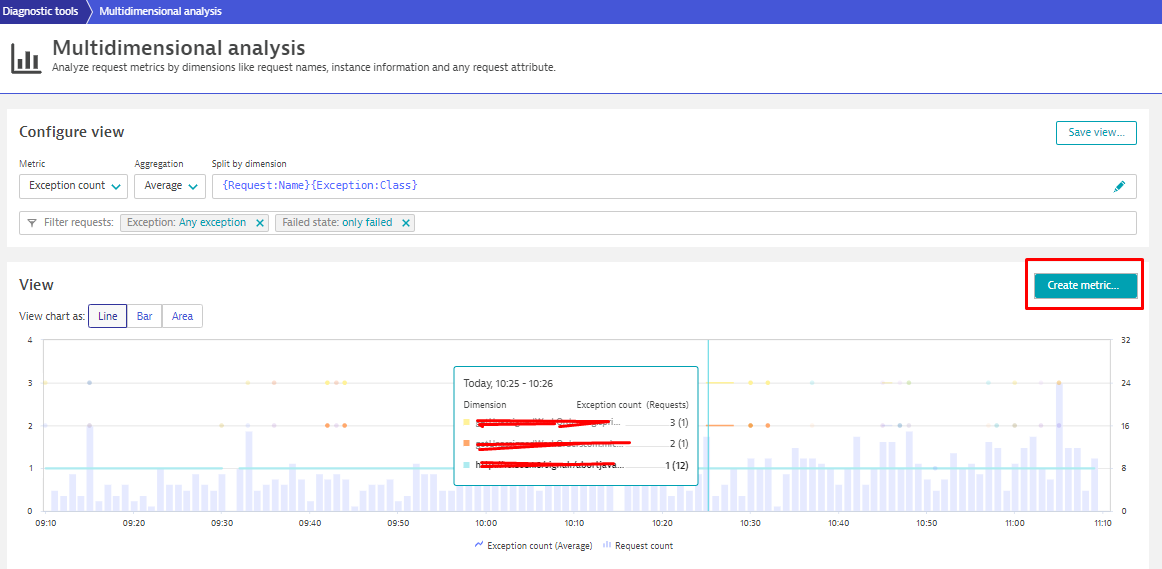
Using Custom Metrics.

- Mark as New
- Subscribe to RSS Feed
- Permalink
21 Jun 2021 10:00 AM - edited 22 Jun 2021 09:18 AM
You use a split option ?
Could you please show the configurator of your Custom metric?
Why you take Average as Aggregation and not Sum or count ?
Also, if there any way to filter by the message of each Exception?
I want also to make another metric base on response time splited by Message.
Have a good day.
Featured Posts
