- Dynatrace Community
- Ask
- Dashboarding
- Is it possible to chart the Impact findings of a specific page over time?
- Subscribe to RSS Feed
- Mark Topic as New
- Mark Topic as Read
- Pin this Topic for Current User
- Printer Friendly Page
- Mark as New
- Subscribe to RSS Feed
- Permalink
14 Oct 2019
10:24 PM
- last edited on
30 Sep 2022
12:20 PM
by
![]() MaciejNeumann
MaciejNeumann
hi All,
In water fall analysis Dynatrace shows the findings it identifies as the factors for performance improvements. But Is it possible in dynatrace to chart the number of uncompressed text files or images that impacting the Visually complete time. So we can see over the releases/changes as we have multiple campaigns on specific pages so the changes are more or less continous and to see if the VC time got impacted due to any of these over time?
Thanks!
Solved! Go to Solution.
- Mark as New
- Subscribe to RSS Feed
- Permalink
15 Oct 2019 08:03 AM
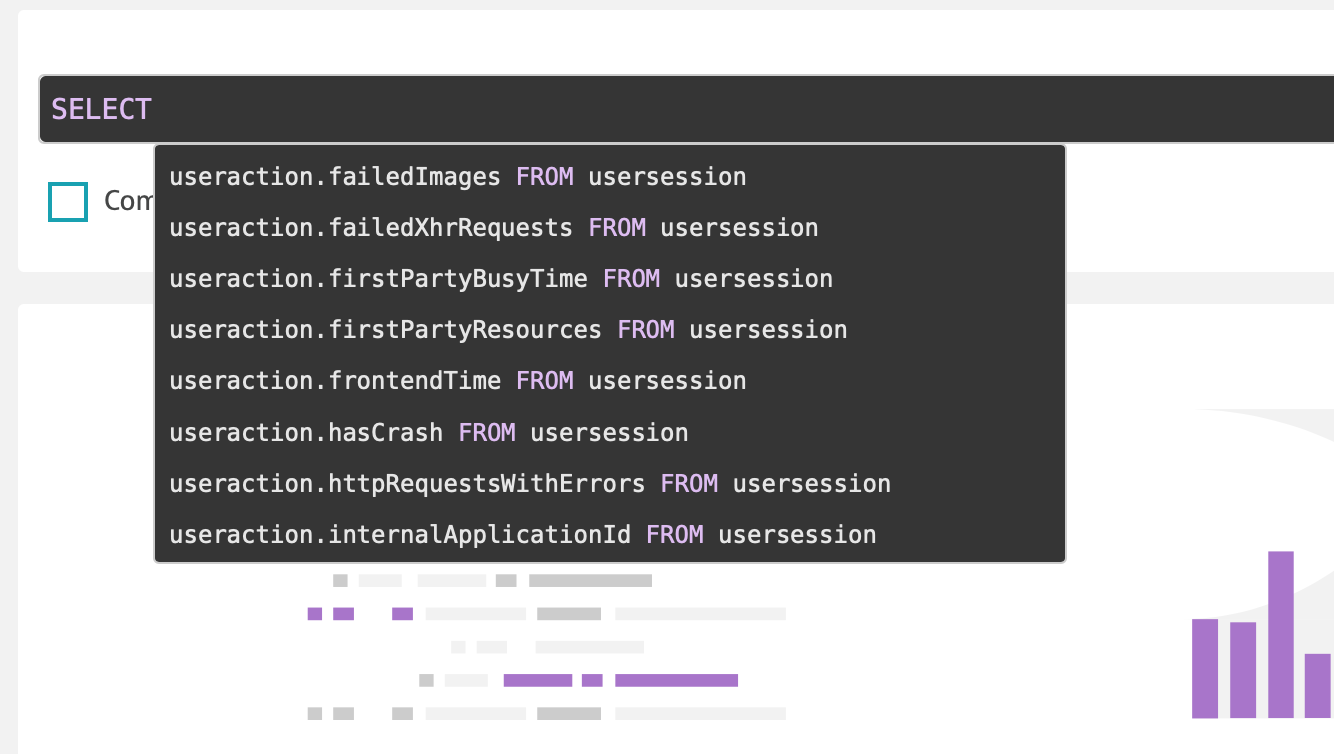
 There are some options, to check number of (first|third|cdn)party resources busy time, resources count etc. You should explore USQL (https://www.dynatrace.com/support/help/how-to-use-dynatrace/real-user-monitoring/how-to-use-real-use...) but I don't think there is option to count uncached elements etc so far. Go there and check what you can get, I think it's best option for now.
Sebastian
Featured Posts
