- Dynatrace Community
- Ask
- Dashboarding
- Is there a way to report/monitor really slow response times?
- Subscribe to RSS Feed
- Mark Topic as New
- Mark Topic as Read
- Pin this Topic for Current User
- Printer Friendly Page
- Mark as New
- Subscribe to RSS Feed
- Permalink
09 Jul 2021
07:44 AM
- last edited on
31 May 2023
02:53 PM
by
![]() Michal_Gebacki
Michal_Gebacki
We have a peculiar problem where our application intermittently slows down. Randomly, response time increases to 5+ min and we are struggling to find a pattern or even a root cause.
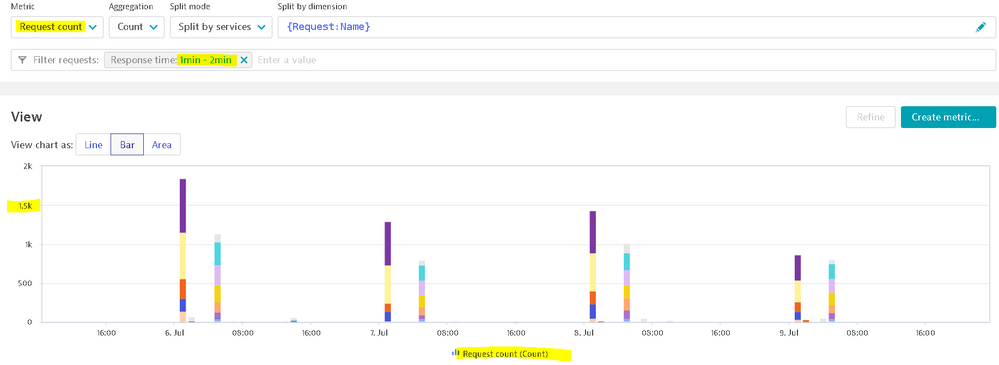
Is there a way to monitor how many times this is happening per day? I created a multidimensional analysis chart for last 30 days with Response time > 1min. This still gives me a bar graph, each bar is 6 hrs. I need something that starts 00:00 and ends 23:59. The idea is that we are making many minor performance improvements, and I want to show the number of intermittent slowness instances - per day - is gradually coming down.
The starting point is the 'Transactions & Services' data. I need an end graph that shows what I want, it need not be a multidimensional analysis chart.
Solved! Go to Solution.
- Mark as New
- Subscribe to RSS Feed
- Permalink
09 Jul 2021 09:11 AM
Don't know the number of requests involved, but would try a list of Purepaths filtered by the slow response time (eg. 1min). That will give you a list of all slow requests. That's where the number of requests comes in: if they are a lot, you might have difficulties approaching the problem from this perspective.
- Mark as New
- Subscribe to RSS Feed
- Permalink
09 Jul 2021 09:24 AM
Hello @phalgun
The last 30 days will change the granularity. I think the useful approach could be to check for the last few days with the maximum 1-day timeframe or even less and then correlate the slowness with the hosts' resources.
Secondly, you can take only a sample of slow PurePaths in different timeframes and check the response time hotspots to analyze the root cause behind the said issue.
Regards,
Babar
- Mark as New
- Subscribe to RSS Feed
- Permalink
09 Jul 2021 09:44 AM
Clarification. My question is not about purepaths or correlation. I know how to do that, and have been doing that precisely for the last few weeks but no RCA yet.
My question is purely a data representation problem. I want DT to tell me how many times, per day, response time exceeds 1 minute. Preferably in a graph that I can simply copy paste in a report to upper management.
- Mark as New
- Subscribe to RSS Feed
- Permalink
09 Jul 2021 05:40 PM
Hello @phalgun
You got emotional 🙂
I thought you are looking for the reason behind this issue. 1-minute aggregation is only for the last 14 days.
In this situation, you can use multidimensional analysis like the following and plot the chart in the form of line, bar, or area.
Regards,
Babar
Featured Posts

