- Dynatrace Community
- Ask
- Dashboarding
- Re: Not able to find Request dimension for splitBy
- Subscribe to RSS Feed
- Mark Topic as New
- Mark Topic as Read
- Pin this Topic for Current User
- Printer Friendly Page
- Mark as New
- Subscribe to RSS Feed
- Permalink
12 Jan 2023
07:02 AM
- last edited on
22 May 2023
03:31 PM
by
![]() Michal_Gebacki
Michal_Gebacki
Hi All,
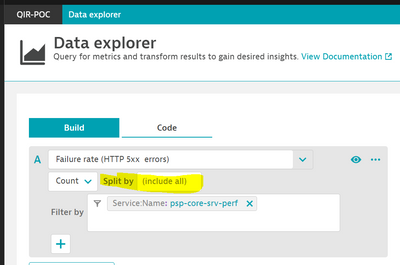
I am new to dynatrace & trying to create dashboards for our Backend applications, as a basic trying to create dashboard with graph to show the failure count of service across different Requests(endpoints), while configuring I am trying to use splitBy on Request, but it does not seem to be accepting Request attribute also could not find any dropdown to select which attributes are allowed. Not sure if the approach is correct . Please correct me if my understanding is not appropriate.
Thanks
Santosh
Solved! Go to Solution.
- Labels:
-
dashboards classic
-
data explorer
- Mark as New
- Subscribe to RSS Feed
- Permalink
12 Jan 2023 08:45 AM
One way to achieve this would be to mark those request to key request.
There is also other way by creating own calculated service metric where you could also utilize the request name as a dimension (splitter) but depending your use case the key request could be the easiest way to start with.
https://www.dynatrace.com/support/help/shortlink/key-requests#create-ui
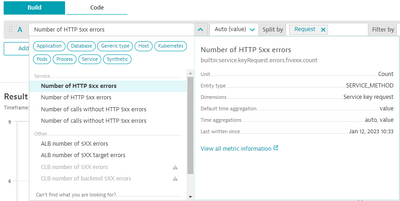
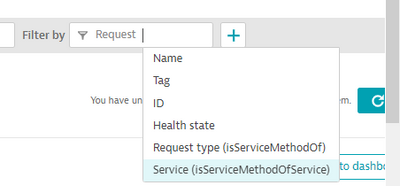
Then you could use the builtin:service.keyRequest.errors.fivexx.count as you metric and split the data per key request. You can filter that data by service name by utilizing the Request.Service -> isServiceMethodOfService -> Name as you filter.
- Mark as New
- Subscribe to RSS Feed
- Permalink
12 Jan 2023 11:25 AM
Hi @janne_olkoniemi , Thanks much for sharing the approaches, I tried the calculated metric approach.
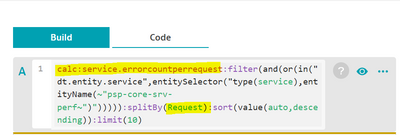
I created calculated metric - errorcountperrequest was able to select the splitBy by Request after adding the Request in the splitBy dimension of the Calculated Metric as shown in the below but when we run the query it does not show any result , though we have some requests happened during the timeframe, any idea what could be the issues, could it be possible that requests are not named properly .
Regards
Santosh
- Mark as New
- Subscribe to RSS Feed
- Permalink
12 Jan 2023 01:00 PM - edited 12 Jan 2023 01:00 PM
Is there any change that you could share your calculated service metric definition so could get a bit better idea which kind of definition you have currrently You can mask every detail which would reveal anything specific from your environment or company.
One thing comes to my mind that the metrics explorer is not going to show-up anything before you get first failed calls in on that service. So the calculated metrics are started to count after the definition and it wouldn't utilize any of your history data.
Best Regards,
Janne
Featured Posts


