- Dynatrace Community
- Ask
- Dashboarding
- Re: Open Problems for a SPECIFIC Service
- Subscribe to RSS Feed
- Mark Topic as New
- Mark Topic as Read
- Pin this Topic for Current User
- Printer Friendly Page
- Mark as New
- Subscribe to RSS Feed
- Permalink
09 Aug 2022
08:48 PM
- last edited on
24 May 2023
11:42 AM
by
![]() Michal_Gebacki
Michal_Gebacki
So when I create an SLO for a specific service, I see the number of open problems/total problems for that specific service. But when I convert that SLO to a dashboard, the problem piece disappears. The only metric I see for problems in the Metrics tab is "Server - Notifications - Problem Notifications", but this is not one that I can split or filter by a service.
Any tips on how I can go about this?
Solved! Go to Solution.
- Mark as New
- Subscribe to RSS Feed
- Permalink
10 Aug 2022 04:26 PM
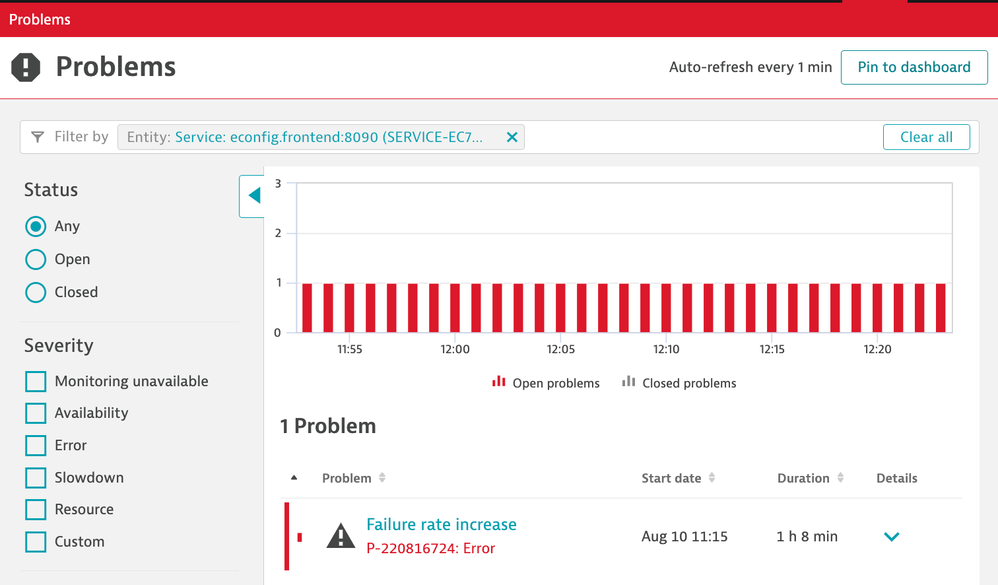
You can add a problem widget for that specific service using filters in the Problems page, and then use the Pin to Dashboard button.
Does it fits for you?
Featured Posts


