- Dynatrace Community
- Ask
- Dashboarding
- Process group downtime per hostname in dashboard
- Subscribe to RSS Feed
- Mark Topic as New
- Mark Topic as Read
- Pin this Topic for Current User
- Printer Friendly Page
- Mark as New
- Subscribe to RSS Feed
- Permalink
10 Nov 2023
04:47 PM
- last edited on
24 Jan 2024
11:42 AM
by
![]() Michal_Gebacki
Michal_Gebacki
Hello
I'm looking for a way to visualize in a dashboard the moments when a process group instance is down on a host.
At this time I'm using the following metric query
builtin:tech.generic.processCount:filter(in("dt.entity.process_group_instance",entitySelector("type(process_group_instance),entityName.equals(~"My Process Group Name~")"))):parents:splitBy("dt.entity.host"):min:names:sort(dimension("dt.entity.host.name",ascending))
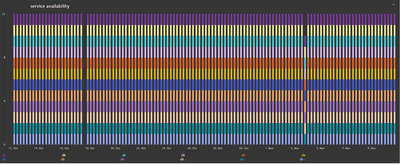
On a dashboard the hostname disappears when the service is down on the host and shows if it's up.
On the contrary, I would like the hostname to appear on the graphic, only if the process group is KO on the hostname.
Is there a metric query to achieve this ?
I attach a screenshot of my actual dashboard.
Regards
Solved! Go to Solution.
- Labels:
-
dashboards
-
metrics
- Mark as New
- Subscribe to RSS Feed
- Permalink
12 Nov 2023 03:48 PM
Hi,
As far as I can recall, such a mechanism that something appears and disappears (as in the case of the hosts you write about) is not present in Dynatrace dashboards.
You might consider to verify the number of active process instances within a process group on a given host:
builtin:tech.generic.processCount
- Mark as New
- Subscribe to RSS Feed
- Permalink
20 Jan 2024 11:36 AM
Hi Radek,
I appreciate your reply
"You might consider to verify the number of active process instances within a process group on a given host:
builtin:tech.generic.processCount"
I would like to do that, how does the query look like in a graph or in a single value dashboard,
I used this successfully to look for the CPU of that particular process
builtin:tech.generic.cpu.usage:filter(eq("dt.entity.process_group_instance",PROCESS_GROUP_INSTANCE-98CB935943677AB7)):splitBy("dt.entity.process_group_instance"):max
I want to have that particular PROCESS_GROUP_INSTANCE
I appreciate you support
Marwan...
- Mark as New
- Subscribe to RSS Feed
- Permalink
21 Jan 2024 04:17 PM
I found the solution by grouping by technology and it works like a charm, I share the code below for anyone who wants to do that.
builtin:tech.generic.processCount:filter(and(or(in("dt.entity.process_group_instance",entitySelector("type(process_group_instance),softwareTechnologies(~"WEBSPHERE~")"))))):splitBy("dt.entity.process_group_instance"):sort(value(auto,descending)):limit(100):lastReal
The only problem still it only shows that processes which are up but not those that are down. When the process is down Dynatrace does not collect and therefore it only shows what is up. This is not very useful.
Any idea?
- Mark as New
- Subscribe to RSS Feed
- Permalink
21 Jan 2024 04:29 PM
I think I was wrong, it should show all up or down state. I just needed to play around with the time frame. So the above solution is perfect and can be used for any process name or technology. This question can now be closed, I hope is useful for eveybody.
Featured Posts

