This website uses Cookies. Click Accept to agree to our website's cookie use as described in our Privacy Policy. Click Preferences to customize your cookie settings.
Dashboarding
Dynatrace dashboards, notebooks, and data explorer explained.
Turn on suggestions
Auto-suggest helps you quickly narrow down your search results by suggesting possible matches as you type.
- Community Home
- Platform
- Dashboarding
- Slow Response Count
Options
- Subscribe to RSS Feed
- Mark Topic as New
- Mark Topic as Read
- Pin this Topic for Current User
- Printer Friendly Page
Options
- Mark as New
- Subscribe to RSS Feed
- Permalink
04 Nov 2020
08:27 AM
- last edited on
31 Aug 2022
10:52 AM
by
![]() MaciejNeumann
MaciejNeumann
HI,
I would like to check the count of slow (over 400ms) service request and display it on the chart of dashboard.
How do I create this metric on Dynatrace? (AppMon could get this slow count setting.) Does anyone have the sample setting?
Best Regards,
Yasuo Ohnishi
Solved! Go to Solution.
Labels:
- Labels:
-
data explorer
-
services classic
3 REPLIES 3
Options
- Mark as New
- Subscribe to RSS Feed
- Permalink
04 Nov 2020 02:23 PM
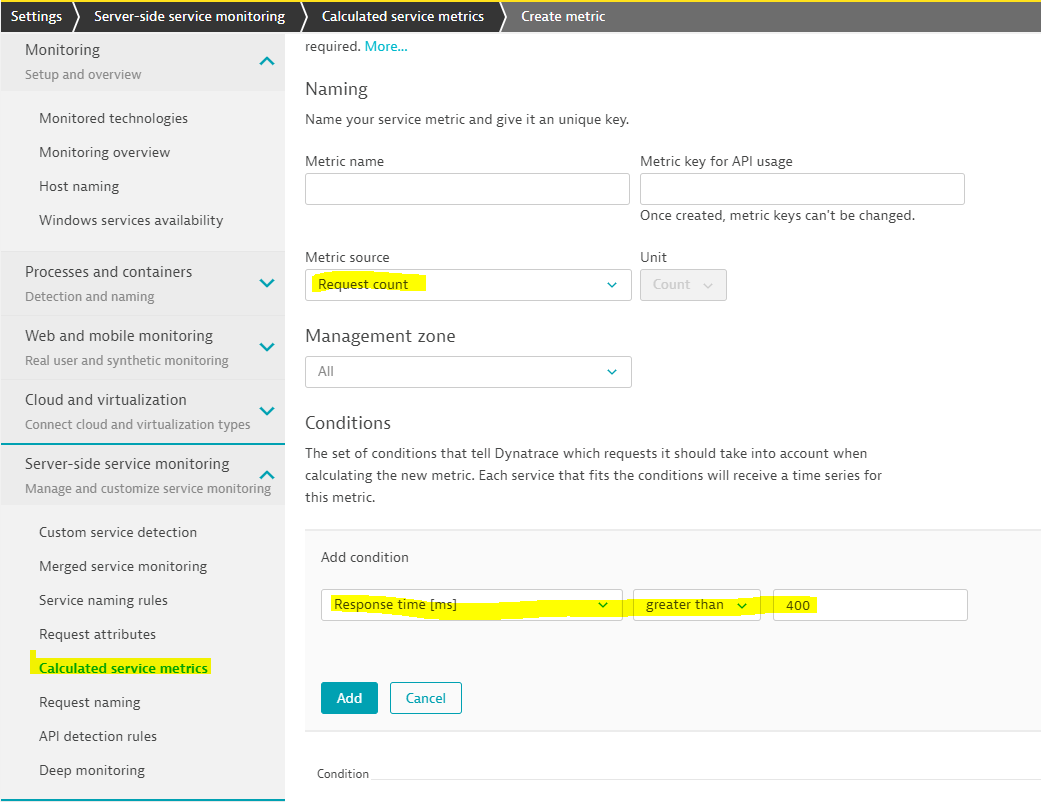
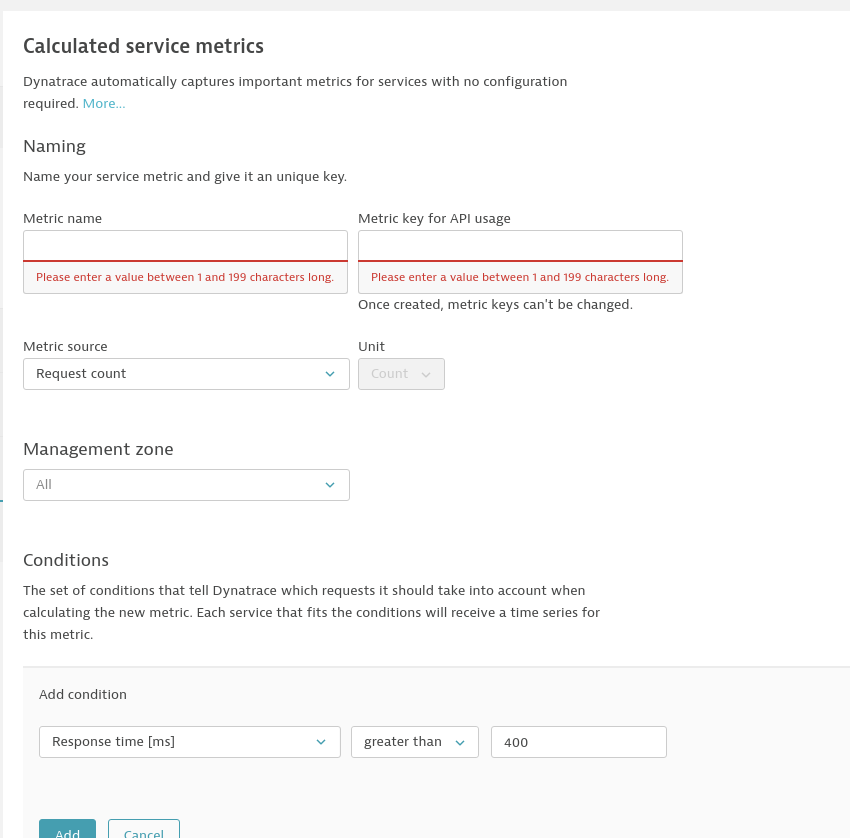
Create a calculated service metric and as a condition add one for your response time. You can also filter it down to the services of interest if needed:
Reply
Options
- Mark as New
- Subscribe to RSS Feed
- Permalink
04 Nov 2020 02:35 PM
You would have to define a calculated service metric for this.
Also, add more conditions so that it only matches on the services you're interested in (service name being one condition you could use for example). Otherwise, every single service in your environment would get a timeseries for this metric.
You can create a custom chart but you cannot set the max to see anything above 400ms:
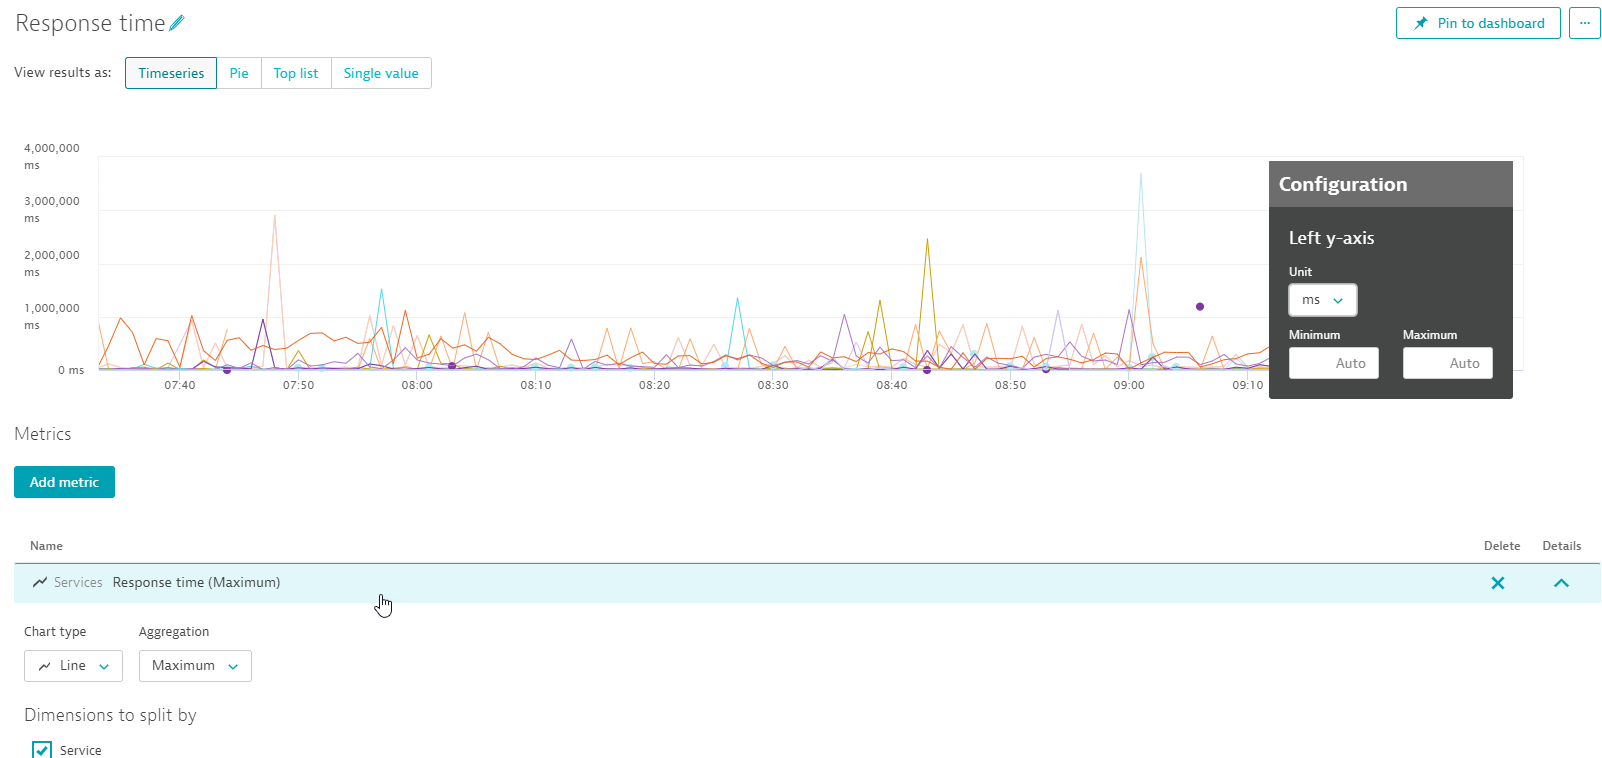
-Chad
Reply
Options
- Mark as New
- Subscribe to RSS Feed
- Permalink
05 Nov 2020 03:16 PM
Hi Chad-san, James-san,
Thank you for your reply.
I understand the setting of the metric. And I found the metric can set from Multidimensional analysis.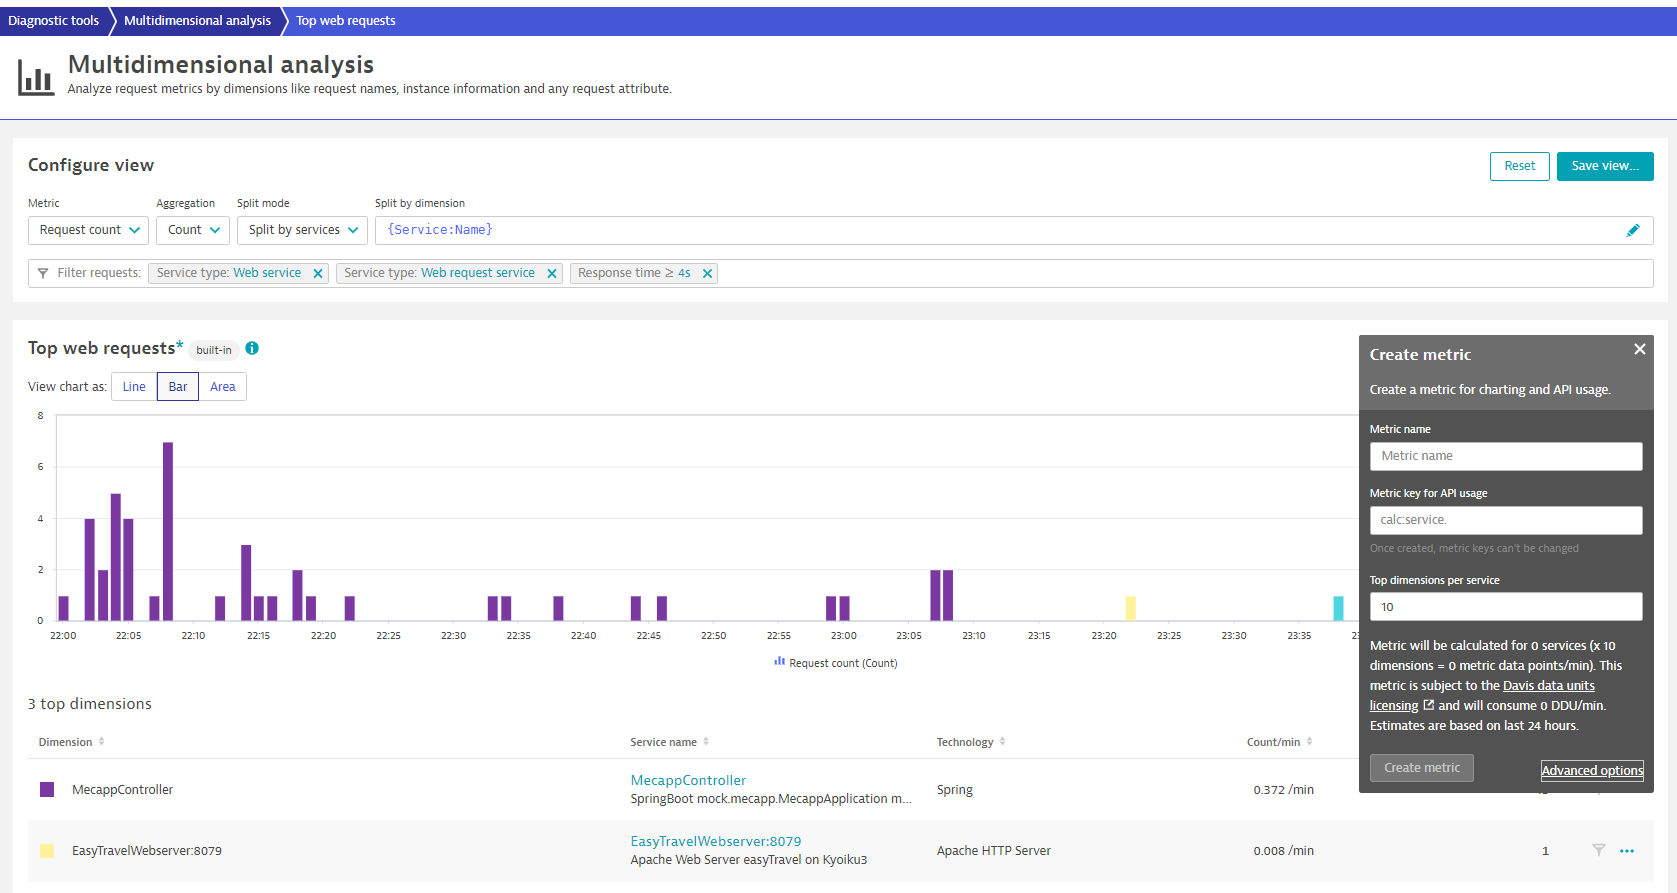
Thank you for your quick answer!
Best Regards,
Yasuo Ohnishi
Reply
Featured Posts
