Turn on suggestions
Auto-suggest helps you quickly narrow down your search results by suggesting possible matches as you type.
- Dynatrace Community
- Dynatrace
- Ask
- Dashboarding
- Re: Top Errors Charted
Options
- Subscribe to RSS Feed
- Mark Topic as New
- Mark Topic as Read
- Pin this Topic for Current User
- Printer Friendly Page
Top Errors Charted
Options
- Mark as New
- Subscribe to RSS Feed
- Permalink
21 Feb 2020
03:50 PM
- last edited on
31 Aug 2022
11:36 AM
by
![]() MaciejNeumann
MaciejNeumann
Hi!
Is possible to "Pin to dashboard", or do something similar, this kind of informations for what concern the error details?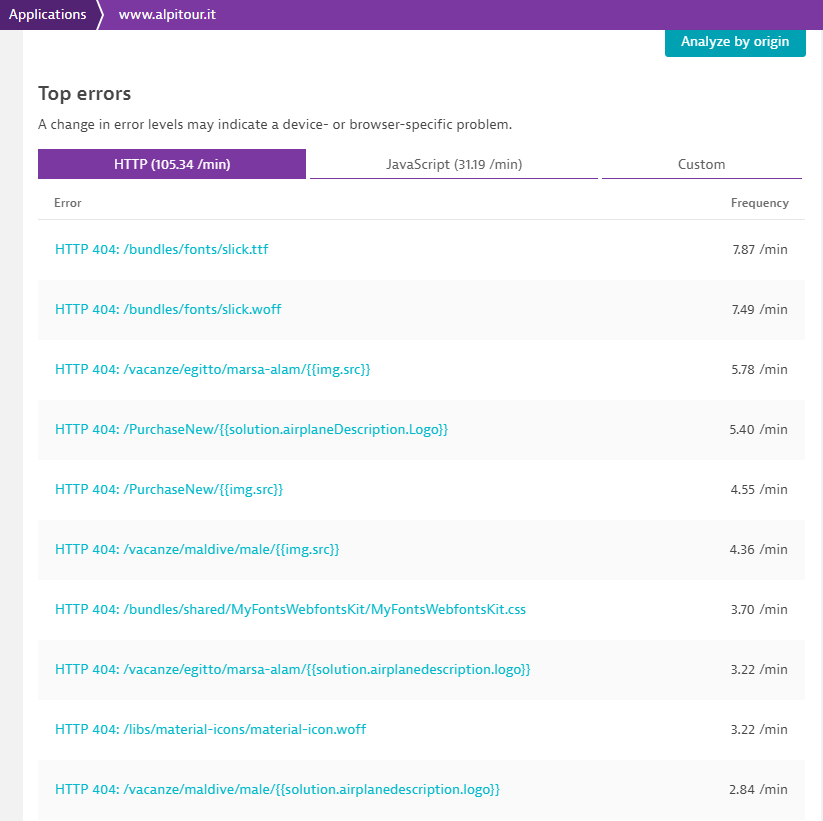
My aim is to have in a new dashboard the most frequent errors, like the image above.
I was trying to use also the USQL but the best that I was able to find was:
SELECT TOP (usererror.name, 10) AS "Error", COUNT(*) AS "Number" FROM usersession WHERE useraction.application IS "app_name" GROUP BY Error ORDER BY Number DESC
Thanks!
Roberto
Certified Dynatrace Professional
Labels:
- Labels:
-
alerting
-
dashboards classic
Reply
10 REPLIES 10
Options
- Mark as New
- Subscribe to RSS Feed
- Permalink
21 Feb 2020 04:05 PM
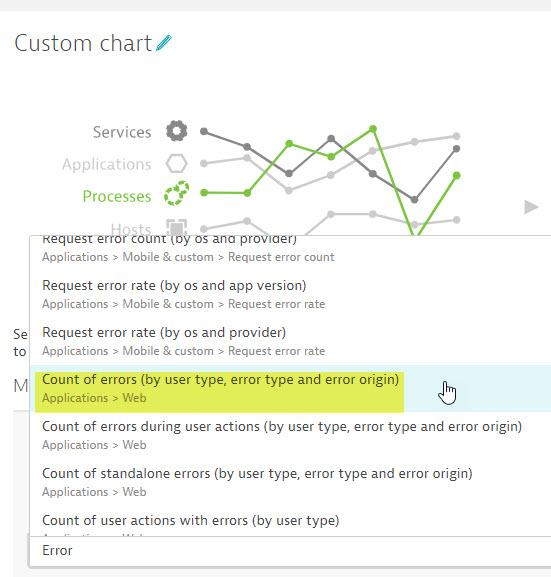
@Roberto R. This is possible by creating a custom chart and selecting Applications > Count of errors by user Type, Error type and Error origin. see the screen shots:
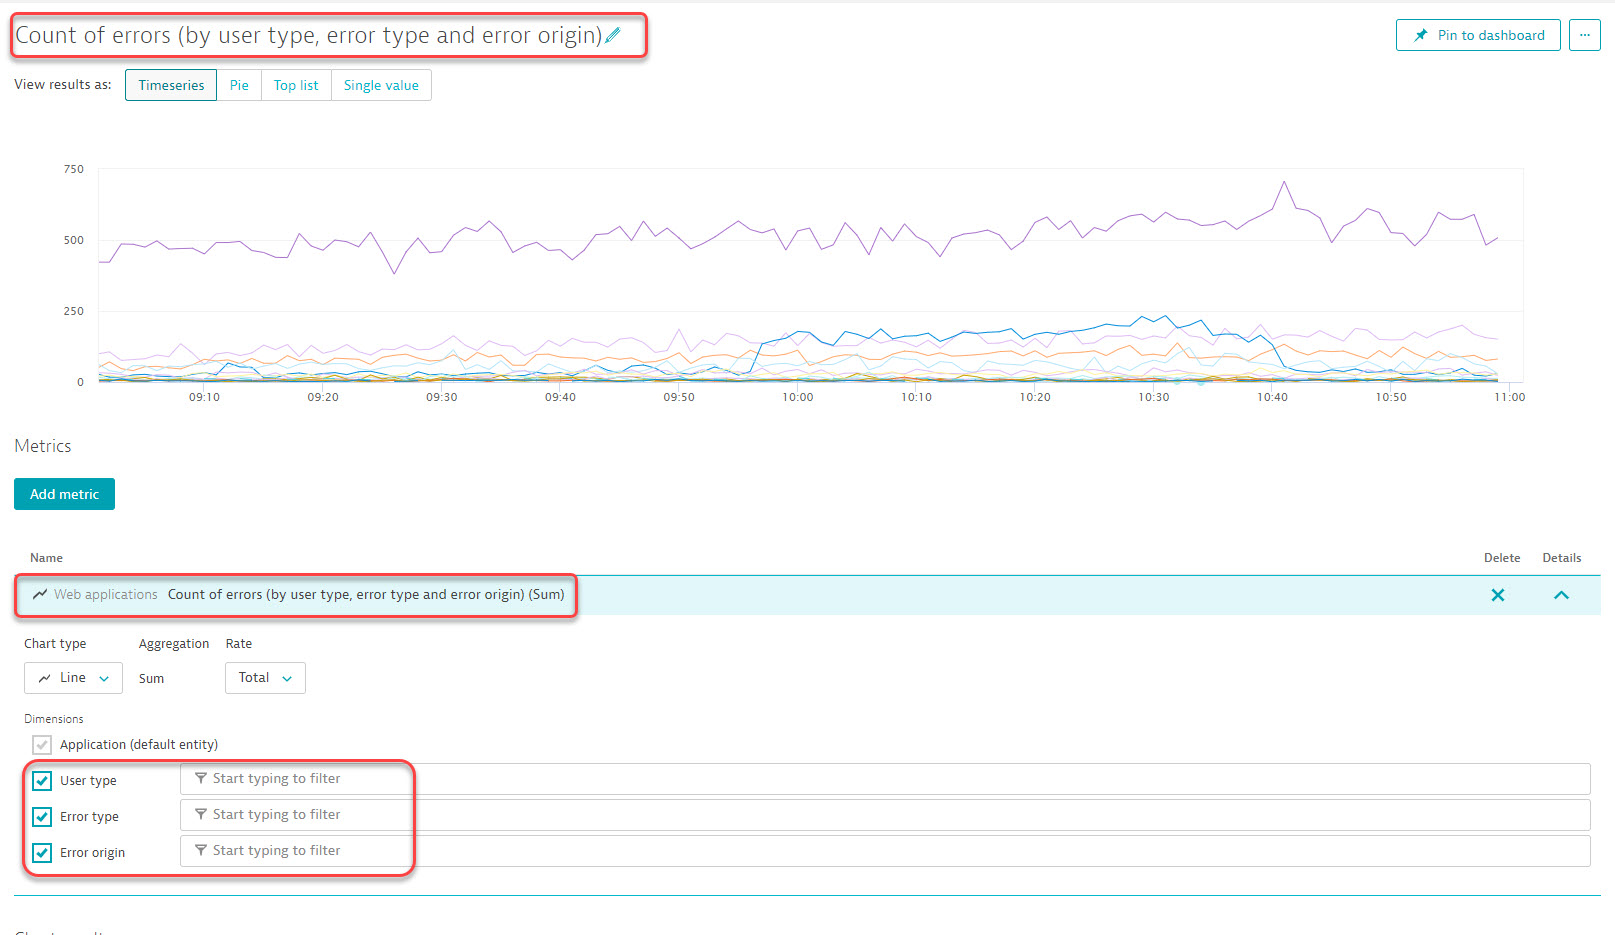 In the last step you have the ability to further customize and filter down your chart. This will be pinned to any dashboard you desire. Let me know if you need any additional assistance.
-Chad
-Chad
Reply
Options
- Mark as New
- Subscribe to RSS Feed
- Permalink
21 Feb 2020 04:15 PM
Hello Chad,
Thanks for the feedback. I have already seen it, but it does not return the details of the HTTP error such as:
"HTTP 404: /bundles/fonts/slick.ttf"
I only have the type of error
Roberto
Certified Dynatrace Professional
Options
- Mark as New
- Subscribe to RSS Feed
- Permalink
21 Feb 2020 04:17 PM
Even with the filtering of HTTP?
-Chad
Options
- Mark as New
- Subscribe to RSS Feed
- Permalink
21 Feb 2020 04:34 PM
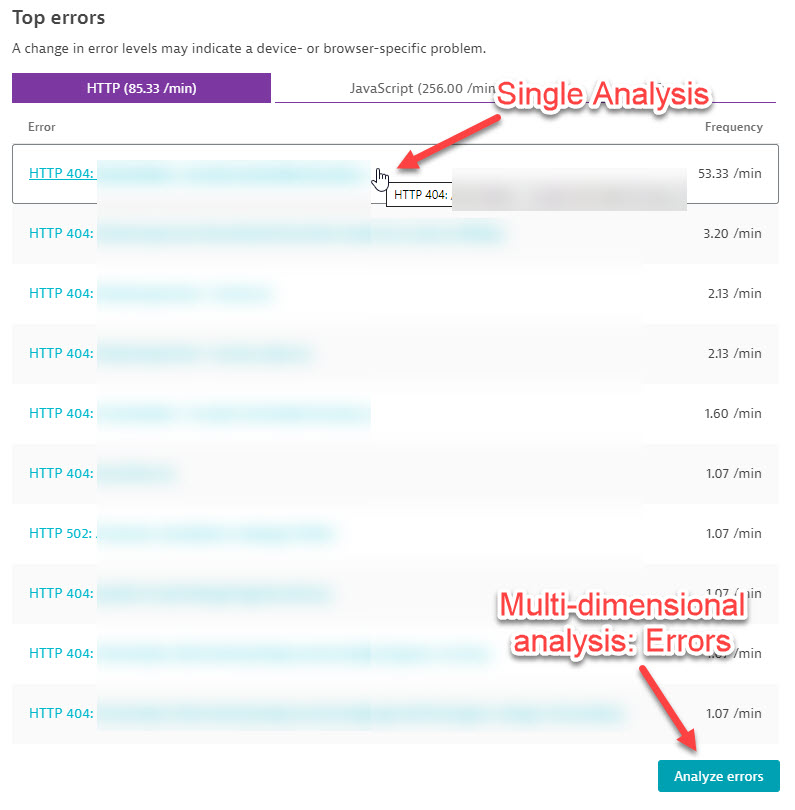
If you want to see that Multi-dimensional analysis: Errors and or the clicking into one of these errors and seeing the details surrounding it...
I would recommend tossing in a Request for Feature as the ability to pin this does not exist yet. For a solution you can put in place today... I would recommend using a markdown tile as such:
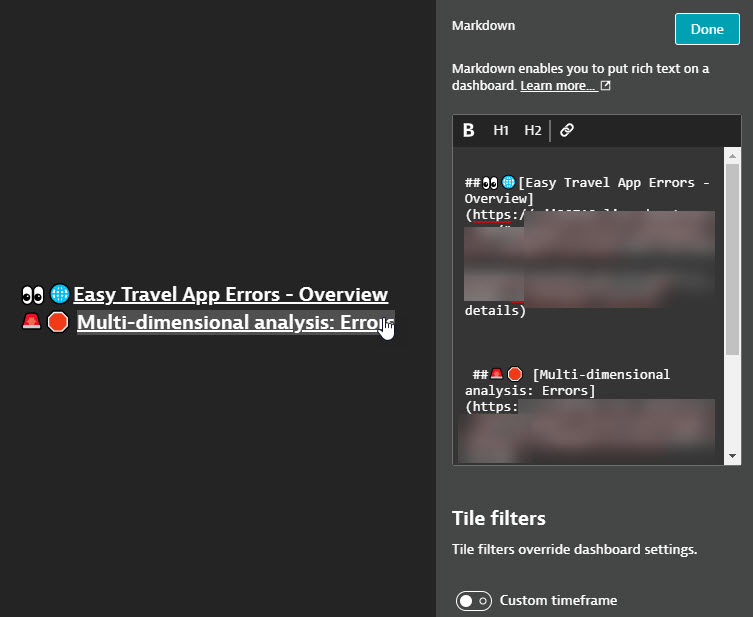
Clicking this link will take you right to the page you desire. but you will not see an overview on the dashboard. that is one drawback.
-Chad
Reply
Options
- Mark as New
- Subscribe to RSS Feed
- Permalink
26 Feb 2020 08:18 AM
Hello Chad,
thanks for the suggestions. Using a markdown tile for link the dashbaord is a good workaround, but I need the overview directly on the dashboard. I've opened a RFE for it.
Thanks for the support.
Roberto
Certified Dynatrace Professional
Reply
Options
- Mark as New
- Subscribe to RSS Feed
- Permalink
27 Feb 2020 03:51 PM
Hi Roberto,
you use custom chart. Search 5xx or 4xx in metrix fields 🙂
Reply
Options
- Mark as New
- Subscribe to RSS Feed
- Permalink
27 Feb 2020 04:20 PM
Hi Domenico,
yes, I was thinking about it but I must use the "service" section for the custom chart.
At the moment I have different management zone configurated by only the single application rule. If I use service for charting, no information are displayed. In the management zone rule configuration I must add all the correct services for do this. Is it correct?
Anyway my aim is to show the top error 4xx 5xx and not only the count, for what that I saw at the moment is not possible 🙂
Thanks,
Roberto
Certified Dynatrace Professional
Options
- Mark as New
- Subscribe to RSS Feed
- Permalink
27 Feb 2020 04:36 PM
Yes. My suggestion is to create automatic rules in order to tag your service and add tag to management zone to filter tiles base on your needs and/or add it to management zone.
Options
- Mark as New
- Subscribe to RSS Feed
- Permalink
07 Jul 2020 04:29 PM
Hi Roberto,
I am looking for the same. I want to pull data for top 10 error in the application and pin it to dashboard. What is the status of your RFE ?
Regards,
Ravi
Options
- Mark as New
- Subscribe to RSS Feed
- Permalink
27 Mar 2023 01:13 PM
Is there any update on this RFE? Or is there another way to show the top (10 for example) JavaScript and HTTP Requests errors on a dashboard?
