- Dynatrace Community
- Ask
- Dynatrace API
- Analyzing Performance in Dynatrace
- Subscribe to RSS Feed
- Mark Topic as New
- Mark Topic as Read
- Pin this Topic for Current User
- Printer Friendly Page
- Mark as New
- Subscribe to RSS Feed
- Permalink
05 Jun 2020 05:22 PM
We currently have a REST API application that is deployed in an Azure VM via IIS. We used Dynatrace to monitor its performance, however there's a particular request that I'm finding hard to understand.

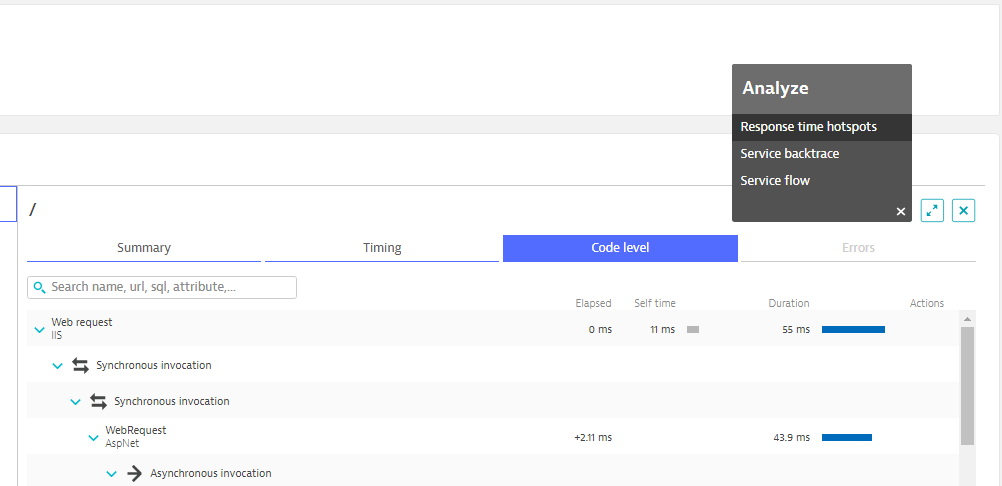
Based from the image above the web request took 14.9 seconds, however the request to the REST API only took 1.37 seconds. There was a self time of 13.5 seconds from IIS. What does this mean?
Solved! Go to Solution.
- Labels:
-
dotnet
-
dynatrace api
- Mark as New
- Subscribe to RSS Feed
- Permalink
05 Jun 2020
07:16 PM
- last edited on
16 Oct 2023
03:25 PM
by
![]() random_user
random_user
It can be inside IIS, and for that you should check if "IIS Modules" is activated and verify if some module is consuming a lot. One such case I haven't yet solved is this one:
https://community.dynatrace.com/spaces/482/dynatrace-open-qa/questions/238759/globalasax.html
It can be something like Suspension, and you can check it in .Net metrics tabs of your IIS processes.
It can also be code running, and that you can check through "Method Hotspots" in your invoked services.
- Mark as New
- Subscribe to RSS Feed
- Permalink
06 Jun 2020 09:03 AM
Hi @Josh M.
As @Antonio S. explained you need to click on the ... under actions and choose Response time hotspots

More information how to use it can be found in documentation
HTH
Yos
- Mark as New
- Subscribe to RSS Feed
- Permalink
08 Jun 2020 12:46 PM
Thank you @Yos N. I was able to identify that it was the middleware that was causing the slowness. It seems weird though that it just happens on a random basis.
Featured Posts
