- Dynatrace Community
- Ask
- Dynatrace API
- Re: Can't see custom metrics created via API in the list of the menu "Create custom chart"
- Subscribe to RSS Feed
- Mark Topic as New
- Mark Topic as Read
- Pin this Topic for Current User
- Printer Friendly Page
- Mark as New
- Subscribe to RSS Feed
- Permalink
13 Nov 2017
04:28 PM
- last edited on
31 Aug 2022
11:00 AM
by
![]() MaciejNeumann
MaciejNeumann
I am trying to create a custom metric and add some custom device.
First I created a custom metrics with API:
HTTP PUT
api/v1/timeseries/custom:nas.connections.dropped?Api-Token=my_token
{
	"displayName" : "Nas connection dropped",
	"unit" : "Count",
	"dimensions": [
		"nic"
	],
	"types": [
		"NAS"
	]
}
Then I added a custom device with some data
HTTP POST
api/v1/entity/infrastructure/custom/SMNAS01?Api-Token=my_token
{
  "displayName" : "SMNAS01",
  "ipAddresses" : ["172.20.11.43"],
  "listenPorts" : ["9999"],
  "type" : "NAS",
  "favicon" : "https://maxcdn.icons8.com/Share/icon/Network//nas_filled1600.png",
  "configUrl" : "http://172.20.11.43:80",
  "tags": ["myTagNas", "myTagNas2"],
  "properties" : { "prop1" : "propvalue" },
  "series" : [
    {
      "timeseriesId" : "custom:nas.connections.dropped",
      "dimensions" : { "nic" : "ethernetcard1" },
      "dataPoints" : [[1510309648, 10 ]]
    }
  ]
}
So my custom device SMNAS01 is created, and i can find it on dynatrace web console. However i dont see any data relative to the metrics. And if i go to the menu "Create Custom Chart" I cannot see my custom metrics.. (but i can retrieve it with API)
Any Idea?
Solved! Go to Solution.
- Labels:
-
data explorer
-
dynatrace api
-
metrics
- Mark as New
- Subscribe to RSS Feed
- Permalink
13 Feb 2018 08:28 AM
Hi Quentin.
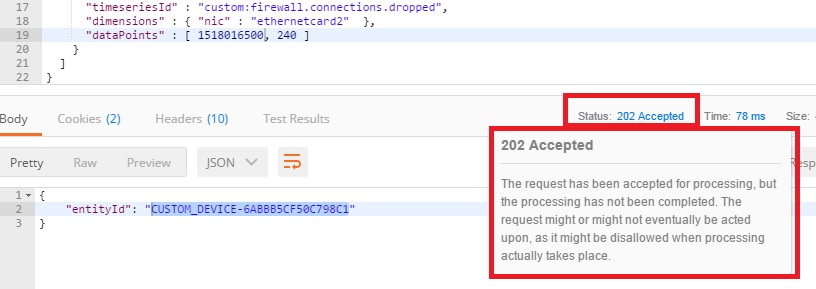
I´m having the same issue. When I call the Dynatrace API to insert the data I get a http Code '202' instead of a http Code '200', I guess that´s why the data is never inserted into Dynatrace:

I raised a Support Case with Dynatrace but am still waiting for their response.
- Mark as New
- Subscribe to RSS Feed
- Permalink
22 Feb 2018 11:14 PM
Hi,
I've the same issue too...
- Mark as New
- Subscribe to RSS Feed
- Permalink
19 Apr 2018 12:51 PM
I have the same issue, glad I'm not alone !!
- Mark as New
- Subscribe to RSS Feed
- Permalink
25 Jun 2018 09:01 AM
Hard to tell what could be the reason you don't get the metric into the custom chart selector. By design it should appear there of course.
Common pitfalls that we identified are:
- Always send the 'type' property with each update of your metric data.
- Check your metric name, its case sensitive.
- Use current timestamp that does not lie in the future and not older than an hour, otherwise your metric data will be rejected.
- Always send the correct dimensions, if you defined ones.
From the example code above it seems that the 'type', dimensions and also metric names are correct. Did you check the timestamp and did you send continuously data?
Do you find your device in Smartscape and does the custom device show some charts?
- Mark as New
- Subscribe to RSS Feed
- Permalink
25 Jun 2018 11:39 AM
Hi, on this side it turned out to be the timestamps we were sending because managed is compensating for timezones. We're on GMT +2 which managed knows about. I was sending timestamps using utcnow() (ie. GMT) but managed is compensating and subtracting the two hours off (because we're on GMT +2) so my metrics were technically four hours behind and enever got displayed. As soon as I started using now() instead of utcnow() to calculate the timestamps, voila !! I started getting metrics.
- Mark as New
- Subscribe to RSS Feed
- Permalink
25 Jun 2018 02:11 PM
We will improve the usability of this API soon in order to return rejection reasons synchronously. So in an upcoming release we will return a error message in case we rejected the timestamp because its too old or in the future.
- Mark as New
- Subscribe to RSS Feed
- Permalink
24 Sep 2022 11:28 PM
Hi Wolfgang,
do you know if this improvement has been implemented yet?
I'm asking you this because I've just faced a problem similar to that one Gregor described and the response I was getting from the server was the following (HTTP status code 202):
{"linesOk":3,"linesInvalid":0,"error":null,"warnings":null}Everything seemed OK but I could not see those metrics in Dynatrace (SAAS). I later discovered that I was sending, in the payload, timestamps in seconds instead of milliseconds:
metric.key,dimension=value gauge,5.9361 1664057158 Once the missing zeros were added, metrics started appearing in the Data Explorer as expected.
It would be nice to be immediately notified of these kinds of errors, avoiding spending time in pernicious troubleshooting.
- Mark as New
- Subscribe to RSS Feed
- Permalink
16 May 2019 10:17 PM
I am experiencing the same issue. What's strange for me is that I can find it if I type in the custom device name in the search field of the Dynatrace web-console. It shows it in the results and you can click on the link to get to it
- Mark as New
- Subscribe to RSS Feed
- Permalink
17 May 2019 06:03 PM
Ok this issue for me is now resolved. I opened a support ticket with Dynatrace and a solution was quickly provided: Update my ruleset filter so that it includes custom devices. To do that, you would go to Settings > Preferences > Management zones
- Mark as New
- Subscribe to RSS Feed
- Permalink
17 May 2019 07:25 AM
Please check the list of your custom devices that is accessible in technology screen as shown below:

Search for your custom device and check if your metric appears there.
Did you check my hints above? Timestamp correct?
Featured Posts
