- Dynatrace Community
- Ask
- Dynatrace API
- Re: Dynatrace V2 API - How to Call Kubernetes Metrics?? Any Examples??
- Subscribe to RSS Feed
- Mark Topic as New
- Mark Topic as Read
- Pin this Topic for Current User
- Printer Friendly Page
- Mark as New
- Subscribe to RSS Feed
- Permalink
14 Jun 2021 08:29 PM
I am getting pretty proficient automating the pulling of metrics via the V2 API. My next challenge is how to create basic queries for statistics OpenShift pods from Kubernetes. I am totally stumped.
Anyone have any good examples?
Lou
Solved! Go to Solution.
- Labels:
-
dynatrace api
- Mark as New
- Subscribe to RSS Feed
- Permalink
15 Jun 2021 07:33 AM
If there is a metric for that (Check it in the menu Metrics in UI), then you are able to pull it easily. Is there any specific metric you need to query?
- Mark as New
- Subscribe to RSS Feed
- Permalink
16 Jun 2021 02:47 PM
This is a great list of the metrics and metric keys that are in Dynatrace: https://www.dynatrace.com/support/help/how-to-use-dynatrace/metrics/built-in-metrics/saas/
- Mark as New
- Subscribe to RSS Feed
- Permalink
15 Feb 2023 01:17 PM
So for example, I am trying to pull builtin:containers.cpu.usageMilliCores for an OpenShift entity. I can easily pull that with type(CONTAINER_GROUP_INSTANCE),entityName("my-app"). However I cannot seem to pull by tag that my-app belongs to.
Lou
- Mark as New
- Subscribe to RSS Feed
- Permalink
08 Sep 2023 12:41 AM
Same here would like to be able to see what each container is using as a total for millicores
- Mark as New
- Subscribe to RSS Feed
- Permalink
12 Sep 2023 03:09 AM
i am working on automating the pulling of metrics via the V2 API , could you please help if you have any resources or steps? thank you
- Mark as New
- Subscribe to RSS Feed
- Permalink
12 Sep 2023 07:46 AM
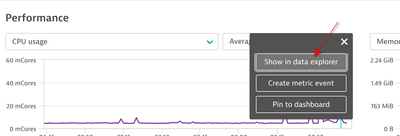
@dynamic for pulling metrics, you need to use the Metrics API - Get metric data points. You need to supply parameters such as entitySelector and timeframe at least. Metric selector and entity selectors can be tricky for beginners, however for the new Unified Analysis Screens it's easy to show it in the data explorer:
And then you can just copy the metric selector from there or also use the filter part as entitySelector.
- Mark as New
- Subscribe to RSS Feed
- Permalink
12 Sep 2023 04:44 PM
I can pull metrics from API, however, I need to automate the next page key to pull data in real-time. and then create a report based on that data. is there an efficient way to do it? the goal is to connect to powerBi
Featured Posts

