- Dynatrace Community
- Ask
- Dynatrace API
- Re: Help on Performance Issue
- Subscribe to RSS Feed
- Mark Topic as New
- Mark Topic as Read
- Pin this Topic for Current User
- Printer Friendly Page
- Mark as New
- Subscribe to RSS Feed
- Permalink
19 Jun 2020
05:53 PM
- last edited on
25 May 2021
11:46 AM
by
![]() MaciejNeumann
MaciejNeumann
We have a .NET Core Web API that is deployed in IIS via port 9090. Yesterday, June 18, it called an .asmx web service which is deployed in a different server and ran for 10 seconds.
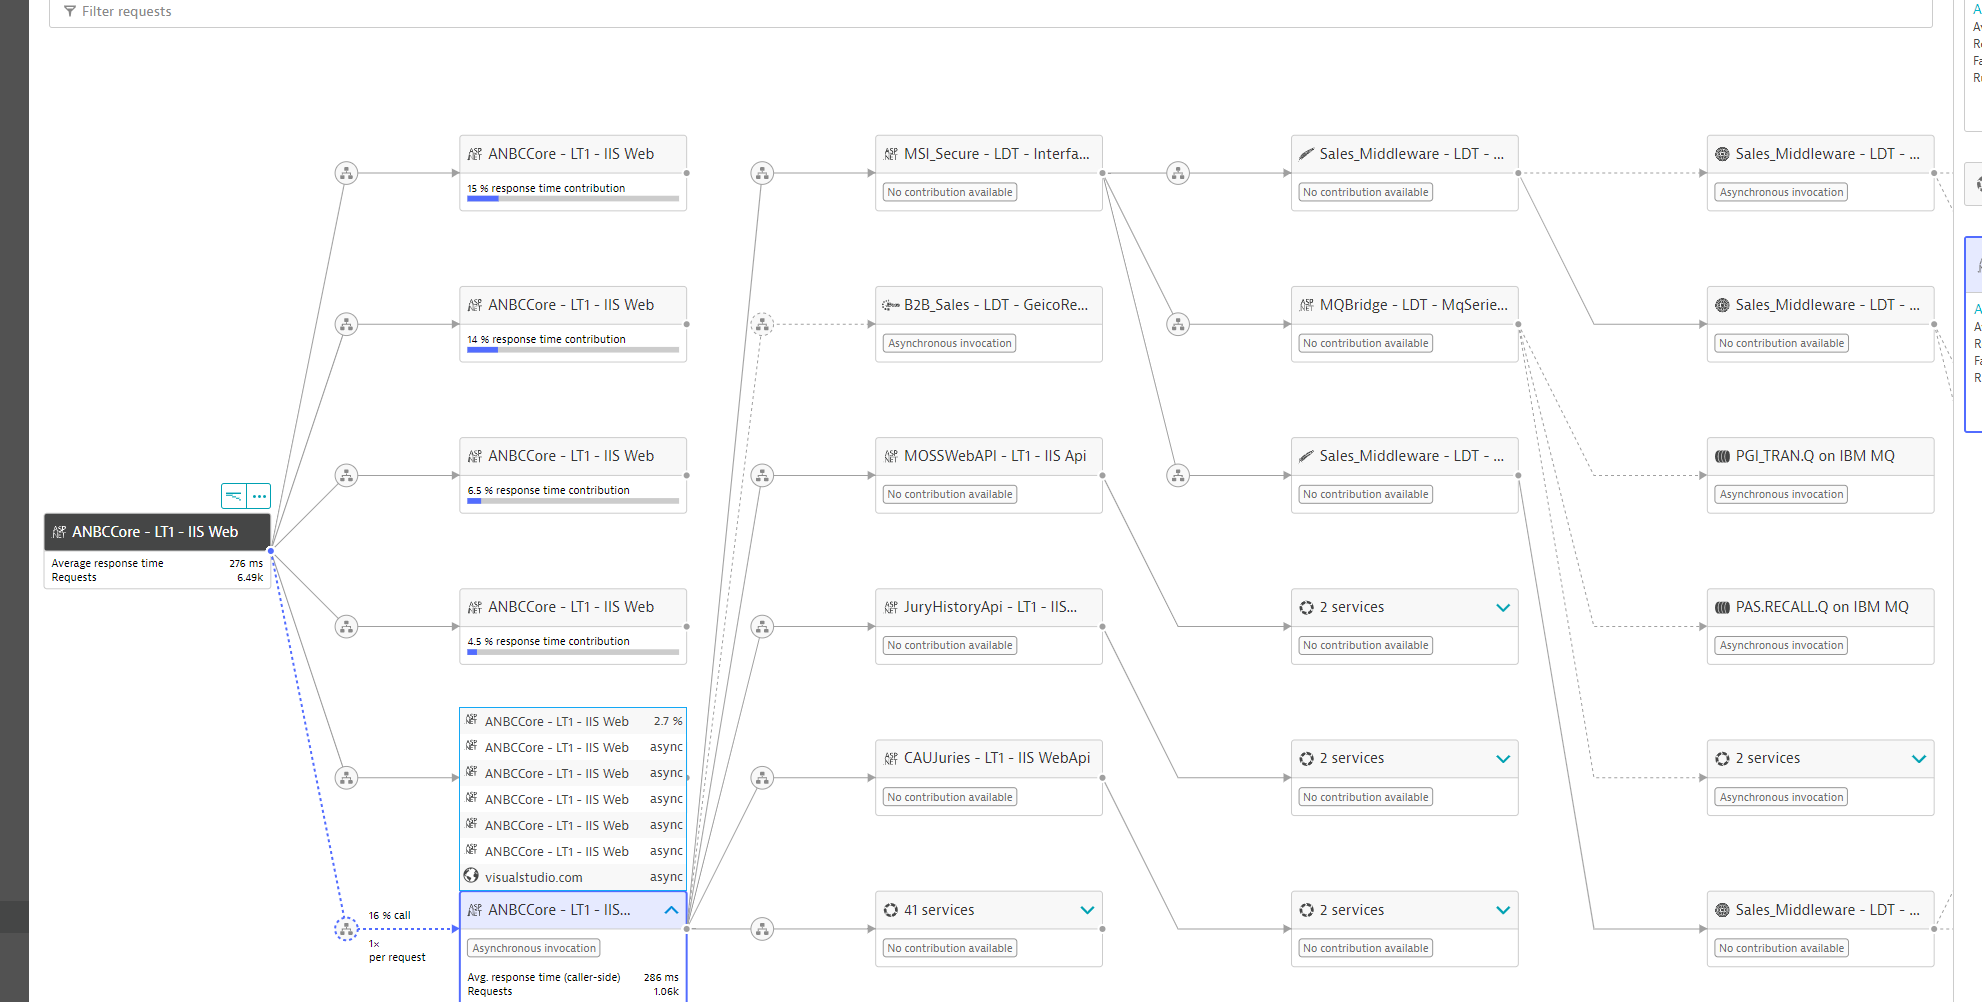
What does the screenshot above mean? Our API took 10s because it took the same amount of time for the request from the web service to be completed? Does this imply that the slowness came from the web service (right) and not the web API (left)?
Solved! Go to Solution.
- Labels:
-
dynatrace api
-
services classic
- Mark as New
- Subscribe to RSS Feed
- Permalink
19 Jun 2020 06:12 PM
Hi Josh,
Based on the screenshot that is indeed what I would infer. A call is sent from 9090 to asmx. it took 10.1 seconds for asmx to respond back to 9090. The total response time for 9090 was also 10.1 seconds – this would imply that virtually all time was spent interacting with asmx.
Again, this is based on the screenshot. You could drill down into the PurePath and see exactly what is happening and which methods are indeed causing the long response time in asmx.
Sia
- Mark as New
- Subscribe to RSS Feed
- Permalink
19 Jun 2020 06:38 PM
So from your image, the response time on the left is a SUM of the response time for all actions that would pass after that, So since you have 1 the total is the same, so the ASMX is what took 10.1s.
A more Complex Request will show a better understanding where you can click in and say, Ahh yes, 14% of the requests hit "X" and it takes "X" ammount of time to process

Featured Posts
