- Dynatrace Community
- Ask
- Dynatrace Managed Q&A
- Re: How to identify the object that caused the root cause analysis as identified by oneagent AI?
- Subscribe to RSS Feed
- Mark Topic as New
- Mark Topic as Read
- Pin this Topic for Current User
- Printer Friendly Page
- Mark as New
- Subscribe to RSS Feed
- Permalink
23 Mar 2018
07:10 AM
- last edited on
03 Dec 2024
09:11 AM
by
![]() MaciejNeumann
MaciejNeumann
We are using Dynatrace Oneagent in Managed environment in our organisation. We have seen that artificial intelligence identifies the root cause for a problem has been due to long garbage collection time for our websphere JVM. But we could not identify what object has caused the long garbage collection. We have used the analyze logs but cannot identify much from the logs. can we get something in the tool where we can identify which object has caused the garbage collection to take more time?
Solved! Go to Solution.
- Labels:
-
dynatrace managed
-
jvm
-
problem detection
- Mark as New
- Subscribe to RSS Feed
- Permalink
23 Mar 2018 08:01 AM
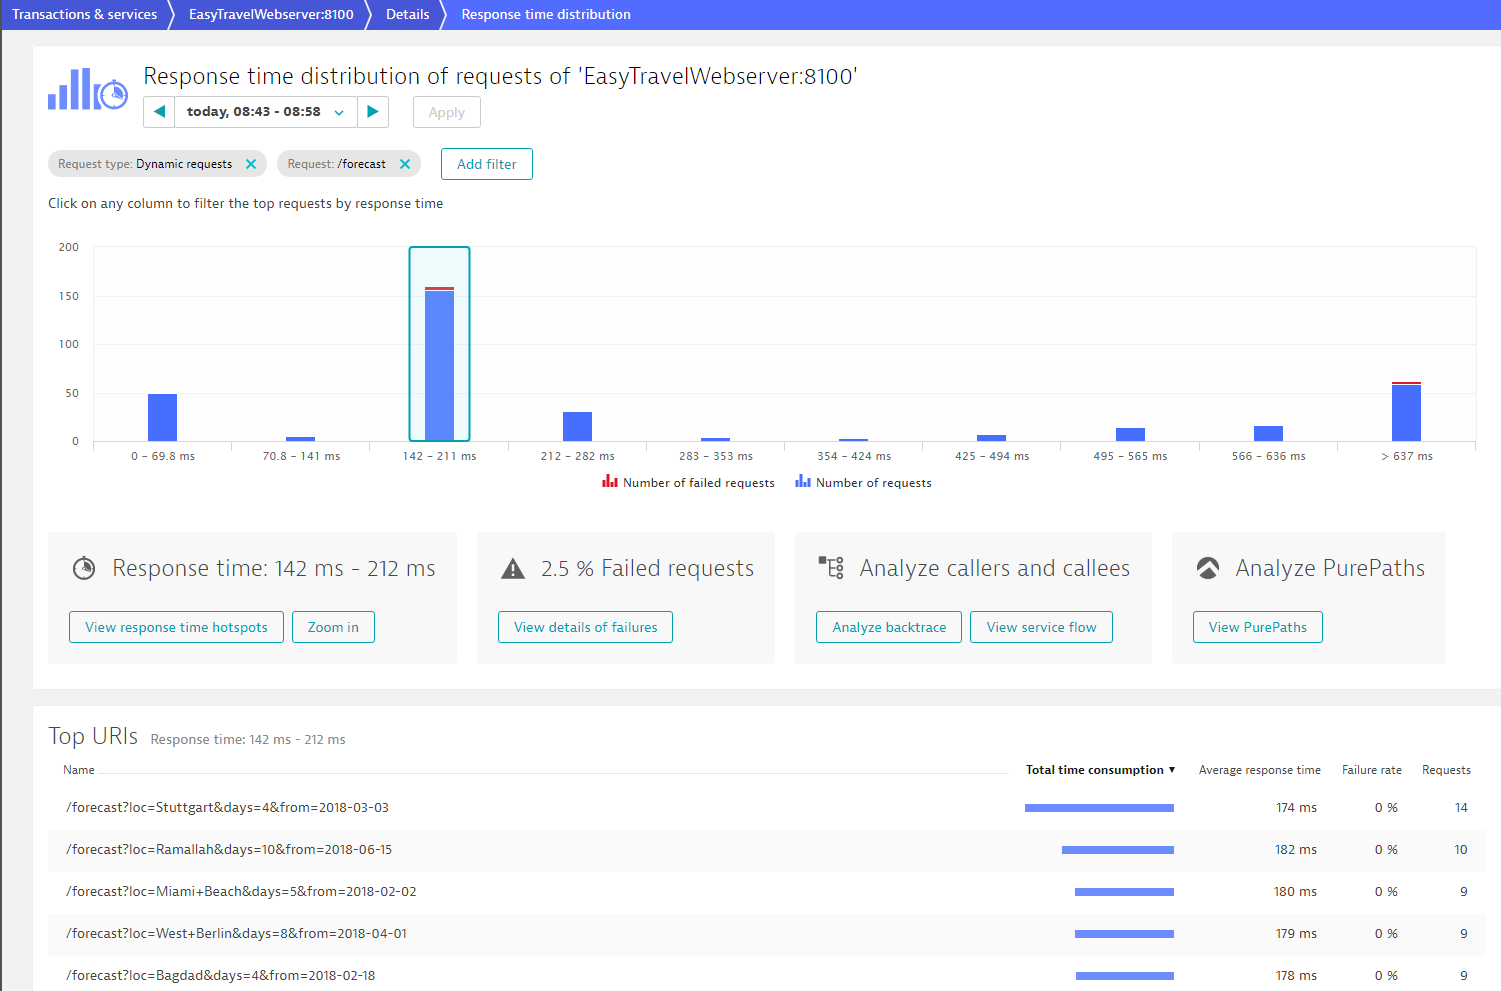
Once AI detected the root-cause entity you have to visit the highlighted service and dive deeper into code level details where resource consumption is shown for the complete stack trace of each transaction during the problem timeframe.

Featured Posts
