- Dynatrace Community
- Ask
- Open Q&A
- Web Problem Detection not working
- Subscribe to RSS Feed
- Mark Topic as New
- Mark Topic as Read
- Pin this Topic for Current User
- Printer Friendly Page
- Mark as New
- Subscribe to RSS Feed
- Permalink
22 Feb 2023
07:07 AM
- last edited on
22 Feb 2023
08:44 AM
by
![]() MaciejNeumann
MaciejNeumann
Hi all,
I want to explore the https://www.dynatrace.com/support/help/observe-and-explore/davis-ai/problem-and-root-cause but it's not working.
I'm working with JQuery, Spring Boot.
I have tried the following scenarios:
1) Get Request for 5 minutes
2) Get Request with Http Code 500
3) Get Request for Image 404
4) Javascript Error
5) Every 500 ms for the #3
6) Every 1000 ms for the #2
Next is the Settings > Anomaly Detection
Detect increases in JavaScript errors is Turned ON
Using fixed thresholds
1% Alert if this custom error rate threshold is exceeded during any 5 minute period
10 minimum number of action per minute
High Sensitivity
1 minute Amount of minutes the observed traffic has to stay in abnormal state before alert
Next is for Request Errors:
HTTP 500-599 Capture/Impact Apdex/Consider for Davis
HTTP 400-499 Capture/Impact Apdex
Errors with failed image requests Capture/Consider for Davis
Why am I not getting Problems?
Regards,
Abner
Solved! Go to Solution.
- Mark as New
- Subscribe to RSS Feed
- Permalink
22 Feb 2023 08:36 AM - edited 22 Feb 2023 08:38 AM
Static thresholds should be working, if there will be traffic (10 minimum number of action\requests per minute)
Automatic baseline thresholds will work after two hours for service.
If your service has no load for 80% time - there will no alerts. Your service must have traffic more than 20% time on the week.
Regards,
Romanenkov Alex
- Mark as New
- Subscribe to RSS Feed
- Permalink
22 Feb 2023 09:10 AM
Hi Romanenkov Alex,
Thank you for the reply.
So what should I do?
- Mark as New
- Subscribe to RSS Feed
- Permalink
22 Feb 2023 03:18 PM - edited 22 Feb 2023 03:26 PM
Abner, as I understand you want to try automatic baselining.
If it is your test environment (imagine this) you need to have some synthetic traffic, for example using selenium with web driver. Make some scenario - for example - susscessfull login without errors.
Make it work for 24 hours.
Check that your traffic exceeds "10 minimum number of actions per minute" or set this value lower.
On the next day you can access your application and have a scenario with error.
If your synthetic has no error at all, you have "0%" baseline error rate.
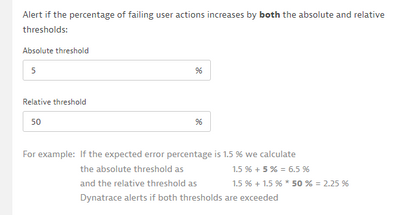
If your impact will more than both the absolute and relative thresholds - Dynatrace will rise an error.
In this example - for my app expected error rate 1.5% If I will get 10% - Dynatrace will rise error for me.
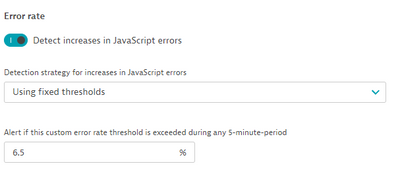
If you can't\won't wait time - you can use fixed thresholds. For my app I know the expected error rate. For example errors by entering CAPTCHA. I always miss this 😉
For me it is 1.5. For my SLA for this web application is 5% errors (other errors not related with entering CAPTCHA) and I want to get notified if there are others errors in my example. I set this threshold - 6.5 to achieve this. This is only example for me.
Regards,
Alex
- Mark as New
- Subscribe to RSS Feed
- Permalink
22 Feb 2023 03:20 PM
For example for services - you need 2 hours to get first baseline value and automatic thresholds working.
- Mark as New
- Subscribe to RSS Feed
- Permalink
23 Feb 2023 02:47 AM
HI @Romanenkov_Al3x ,
Do you mean for 2 hours, I need to open my web, run my XHR, then end session?
What do you mean by "service"?
Regards,
Abner
- Mark as New
- Subscribe to RSS Feed
- Permalink
23 Feb 2023 11:02 AM
I recommend to have 24 hours for it.
Some events - for example - unexpected low traffic will rise only after 7 days.
Service it is my favorite object in Dynatrace. It is frontend\backend object of you app. For example you deploy Apache HTTPD or NGINX with "Hello this is NGINX default page". When you call HTTP request to the web server, Dynatrace will create "Service" for you. All requests related to this endpoint (for example - localhost:80) will in this object.
Please, read more documentation about it. Dynatrace Doc Team do their work best.
Regards,
Alex
Featured Posts


