- Dynatrace Community
- Learn
- Dynatrace tips
- Custom Database Queries
- Subscribe to RSS Feed
- Mark Topic as New
- Mark Topic as Read
- Pin this Topic for Current User
- Printer Friendly Page
- Mark as New
- Subscribe to RSS Feed
- Permalink
01 May 2022
04:40 PM
- last edited on
06 May 2022
11:10 AM
by
![]() MaciejNeumann
MaciejNeumann
Custom Database Queries is a new extension "to bring in business data, job processing metrics, database and table statistics, anything that is stored in your Databases" into Dynatrace!
It doesn't seem to be an Extension 2.0 yet, but the corresponding documentation pages about the SQL Data sources are already out there:
https://www.dynatrace.com/support/help/extend-dynatrace/extensions20/data-sources/sql
Although I have not yet tried it out, it looks very promising!
Solved! Go to Solution.
- Labels:
-
databases
-
extensions
-
tips and tricks
- Mark as New
- Subscribe to RSS Feed
- Permalink
07 Jul 2022 10:53 AM - edited 28 Jul 2022 06:43 AM
I received a question from a customer about this extension. I will try this extension once.
- Mark as New
- Subscribe to RSS Feed
- Permalink
07 Jul 2022 12:24 PM
One of our client used for Oracle DB monitoring to ingest custom metric into Dynatrace, works fine !
- Mark as New
- Subscribe to RSS Feed
- Permalink
08 Jul 2022 03:18 PM
We started using this extension recently and its been very helpful. Hope it is moved to v2 soon.
- Mark as New
- Subscribe to RSS Feed
- Permalink
08 Jul 2022 05:00 PM
It is a great tool. It opens lot of new opportunities to correlate business and IT performance data in real time. Extension configuration is quite easy. Remoteplugin log is very useful during the configuration on the installed AG. My only probelm is: similar to other AG extensions, in case of issue with the AG there is no data. See attached an example dashbord piece.
- Mark as New
- Subscribe to RSS Feed
- Permalink
28 Jul 2022 01:13 AM
This feature seems very exciting to explore but according to Cluster update 1.246 this has been suspended due to Security concerns. @AntonioSousa is this correct?
Quoting the release notes
"
Infrastructure Monitoring
- Due to security concerns, we have blocked custom SQL extensions using the Extensions 2.0 framework. (APM-378722)"
- Mark as New
- Subscribe to RSS Feed
- Permalink
28 Jul 2022 01:16 AM
This feature seems very exciting to explore but according to Cluster update 1.246 this has been suspended due to Security concerns. @AntonioSousa is this correct?
Quoting the release notes
"
Infrastructure Monitoring
- Due to security concerns, we have blocked custom SQL extensions using the Extensions 2.0 framework. (APM-378722)"
- Mark as New
- Subscribe to RSS Feed
- Permalink
28 Jul 2022 09:02 AM
Not quite sure about the Release Notes. I can confirm that my custom queries keep working under 1.246. In any case, the one I'm using is not the extensions v2, so shouldn't be affected.
- Mark as New
- Subscribe to RSS Feed
- Permalink
02 Aug 2022 04:24 PM
It does not affect this plugin. We checked with Dynatrace. Our plugin is still working also.
- Mark as New
- Subscribe to RSS Feed
- Permalink
02 Aug 2022 04:22 PM
We use to check sql blocking and chart it in dynatrace. Love it
- Mark as New
- Subscribe to RSS Feed
- Permalink
23 Nov 2022 06:05 AM
Hi all,
We have configured the same but not getting proper output metrics.
can you help me to configure the same?
Actually we want the output of custom query and set alerting on the output of that query.
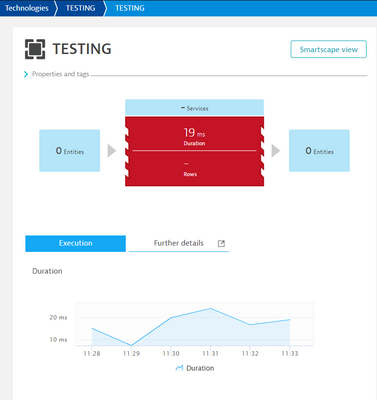
In data explore we are not able to get the db output matrices.
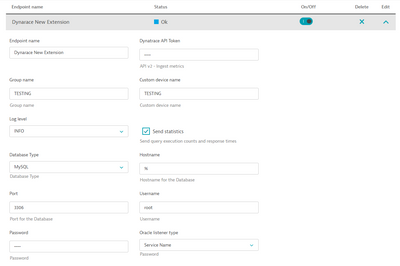
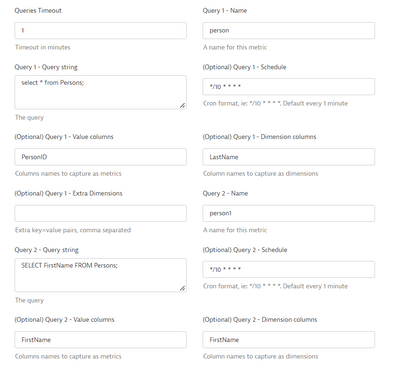
We have mentioned the configuration and output below,
OUTPUT:
Thank you in advance.
- Mark as New
- Subscribe to RSS Feed
- Permalink
21 Nov 2023 09:51 AM
Hello Sanket,
May i know how you achieve this ? I'm dealing with same case so need suggestions.
- Mark as New
- Subscribe to RSS Feed
- Permalink
23 Nov 2022 06:19 AM
Hi @Sanket_Molavade,
Could you please check my post?
Solved: Re: Generic DB Query Plugin - Dynatrace Community
If you need any further support please let me know.
Best regards,
Mizső
- Mark as New
- Subscribe to RSS Feed
- Permalink
21 Nov 2023 09:59 AM
Hello Mizso,
How we can set the alert/threshold on output of custom query ??
- Mark as New
- Subscribe to RSS Feed
- Permalink
21 Nov 2023 10:41 PM - edited 21 Nov 2023 10:42 PM
Hi @Shivanish,
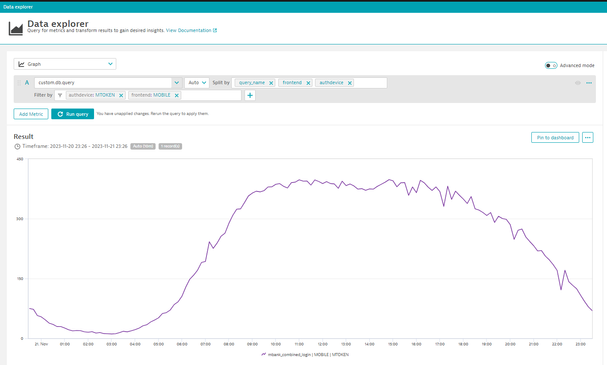
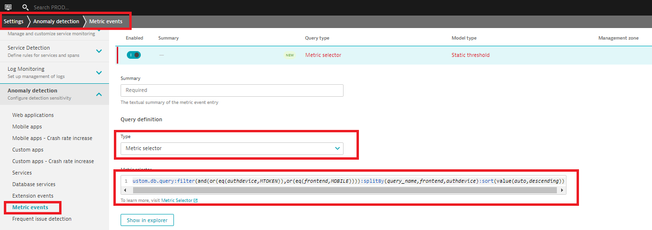
Custom query create a metric: custom.db.query. You can use it to create a metric event.
In data explorer you can create a metric expression by splitting and filtering your custom db query metric by its dimenasions. Here is an example:
Create metric expression by advance mode you can copy it to the metric event creation:
Create a metric event by the metric expression:
Then you need an any alareing profile and a problem notification integration eg, for e-mail alerting.
I hope it helps.
Best regards,
Mizső
- Mark as New
- Subscribe to RSS Feed
- Permalink
19 Dec 2022 10:33 AM
Right now, still unable to upload SQL Extension 2.0.
But for your information, Dynatrace support told me 1.257 release will allow again custom SQL query with extension V2 🙂
Featured Posts
